从 NumPy 数组绘制线图
为了在Python中绘制图形,我们将使用 Matplotlib 库。 Matplotlib 与 NumPy 数据一起用于绘制任何类型的图形。在 matplotlib 中,我们使用了特定的函数,即pyplot() ,它用于绘制二维数据。
使用的不同功能解释如下:
- np.arange(start, end):此函数从区间 [start, end) 返回等距的值。
- plt.title():用于给图形赋予标题。标题作为参数传递给此函数。
- plt.xlabel():设置 X 轴的标签名称。 X 轴的名称作为参数传递给此函数。
- plt.ylabel():设置 Y 轴的标签名称。 Y 轴的名称作为参数传递给此函数。
- plt.plot():它将传递给它的参数值绘制在一起。
- plt.show():它将所有图形显示到控制台。
示例 1:
Python3
# importing the modules
import numpy as np
import matplotlib.pyplot as plt
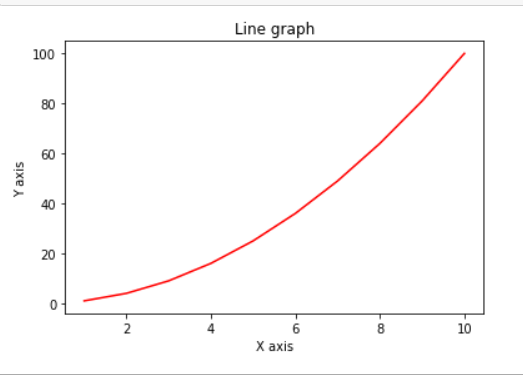
# data to be plotted
x = np.arange(1, 11)
y = x * x
# plotting
plt.title("Line graph")
plt.xlabel("X axis")
plt.ylabel("Y axis")
plt.plot(x, y, color ="red")
plt.show()Python3
# importing the library
import numpy as np
import matplotlib.pyplot as plt
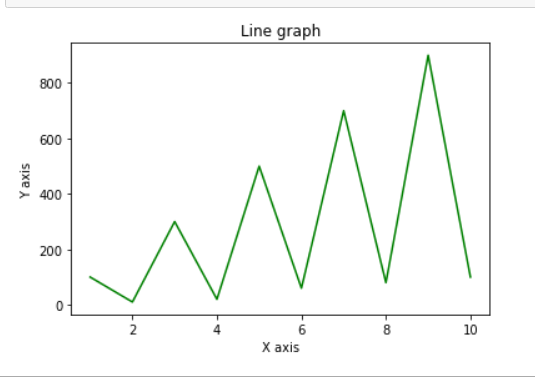
# data to be plotted
x = np.arange(1, 11)
y = np.array([100, 10, 300, 20, 500, 60, 700, 80, 900, 100])
# plotting
plt.title("Line graph")
plt.xlabel("X axis")
plt.ylabel("Y axis")
plt.plot(x, y, color ="green")
plt.show()
输出 :
示例 2:
Python3
# importing the library
import numpy as np
import matplotlib.pyplot as plt

# data to be plotted
x = np.arange(1, 11)
y = np.array([100, 10, 300, 20, 500, 60, 700, 80, 900, 100])

# plotting
plt.title("Line graph")
plt.xlabel("X axis")
plt.ylabel("Y axis")
plt.plot(x, y, color ="green")
plt.show()
输出 :