在 R 中的 ggplot 线图末尾绘制标签
在本文中,我们将研究在 R 编程语言中在 ggplot2 线图的末尾绘制标签的方法。
在这种绘制ggplot2线末端标签的方法中,用户需要在R工作控制台上安装并导入ggplot2和ggrepel包,这里将使用ggplot2包绘制简单的ggplot2线罐和ggrepel包在这里用于在绘制的线图的末尾添加标签,然后用户需要使用 ggplot2 包中的主题函数调用 ggrepel 包中的 geom_label_repel()函数,并根据要求指定其参数,进一步执行此过程将导致绘制到 R 编程语言中 ggplot2 线图末尾的标签。
geom_label_repel()函数用于将文本直接添加到绘图中。 geom_label_repel 在文本下方绘制一个矩形,使其更易于阅读。文本标签彼此排斥并远离数据点。
Syntax:
geom_label_repel( mapping = NULL,data = NULL,stat = “identity”,position = “identity”,parse = FALSE, nudge_x = 0,na.rm)
Parameters:
- mapping:-Set of aesthetic mappings created by aes or aes_. If specified and inherit.aes = TRUE (the default), is combined with the default mapping at the top level of the plot. You only need to supply mapping if there isn’t a mapping defined for the plot.
- data:-A data frame. If specified, overrides the default data frame defined at the top level of the plot.
- stat:-The statistical transformation to use on the data for this layer, as a string.
- position: -Position adjustment, either as a string, or the result of a call to a position adjustment function.
- parse:-If TRUE, the labels will be parsed into expressions and displayed as described in plot math
- na.rm:-If FALSE (the default), removes missing values with a warning. If True silently removes missing values.
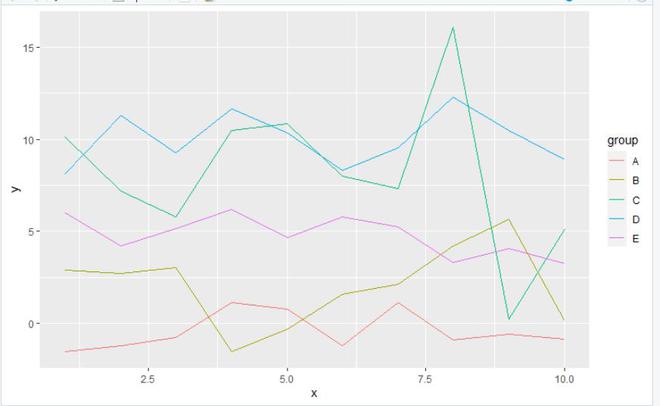
让我们首先绘制一个没有任何变化的常规图,以便差异明显。
示例:初始图
R
library("ggplot2")
library("ggrepel")

gfg<- data.frame(x = 1:10,
                 y = c(rnorm(10),
                       rnorm(10,3,3),
                       rnorm(10, 5, 3),
                       rnorm(10, 10, 1.5),
                       rnorm(10, 5, 2)),
                 group = rep(LETTERS[1:5], each = 10))

ggplot(gfg, aes(x, y, col = group)) +geom_line()
R
library("ggplot2")
library("ggrepel")

gfg<- data.frame(x = 1:10,
                 y = c(rnorm(10),
                       rnorm(10,3,3),
                       rnorm(10, 5, 3),
                       rnorm(10, 10, 1.5),
                       rnorm(10, 5, 2)),
                 group = rep(LETTERS[1:5], each = 10))

gfg$label <- NA

gfg$label[which(gfg$x == max(gfg$x))] <- gfg$group[which(gfg$x == max(gfg$x))]

ggplot(gfg, aes(x, y, col = group)) +geom_line() + geom_label_repel(aes(
  label = label), nudge_x = 1, na.rm = TRUE)
输出:
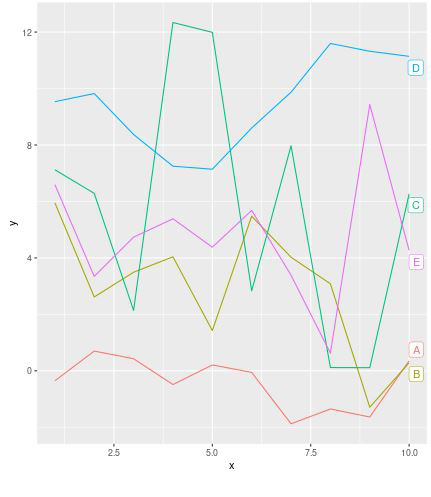
现在让我们根据上述方法应用所需的内容,在最后添加绘图标签。
示例:在最后添加绘图标签
电阻
library("ggplot2")
library("ggrepel")

gfg<- data.frame(x = 1:10,
                 y = c(rnorm(10),
                       rnorm(10,3,3),
                       rnorm(10, 5, 3),
                       rnorm(10, 10, 1.5),
                       rnorm(10, 5, 2)),
                 group = rep(LETTERS[1:5], each = 10))

gfg$label <- NA

gfg$label[which(gfg$x == max(gfg$x))] <- gfg$group[which(gfg$x == max(gfg$x))]

ggplot(gfg, aes(x, y, col = group)) +geom_line() + geom_label_repel(aes(
  label = label), nudge_x = 1, na.rm = TRUE)
输出: