R – 非线性最小二乘
在非线性函数中,绘制在图形上的点不是线性的,因此,不会在图形上给出曲线或直线。因此,非线性回归分析用于改变函数的参数以获得接近数据的曲线或回归线。
为此,非线性最小二乘法用于最小化残差值或误差值的总平方和,即图上垂直点与回归线之间的差异,并将相应地拟合非线性函数。
数学公式:

在哪里,
r is residual or error value between 2 points.上面的数学函数可以使用resid()函数。
回归分析广泛用于所有类型的业务问题,以通过改变业务因素来执行明智的决策或预测未来。
在 R 语言中,非线性最小二乘函数表示为 -
句法:
nls(formula, start)
在哪里,
formula indicates the model formula i.e., non-linear function
start is a list of starting estimates
Note: To know about more optional parameters of nls(), use below command in R console –
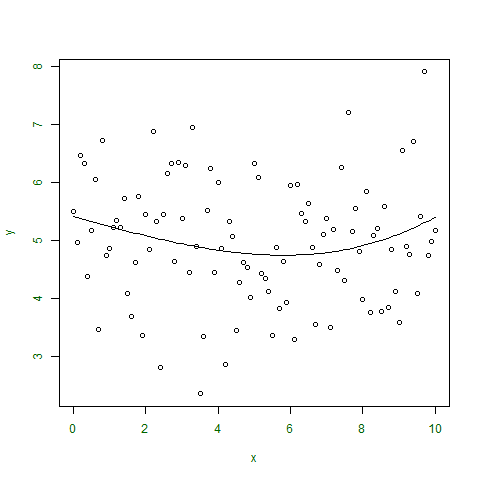
示例 1:
在此示例中,采用非线性函数并将其作为点绘制在图形上。
help("nls")
输出 :
# defining x and y coordinates
x <- seq(0, 10, 0.1)
y <- rnorm(101, 5, 1)

# output to be present as PNG file
png(file ="nls.png")

# Taking the model to get fitted
m <- nls(y~a * x ^ 3 + b * x + c,
         start = list(a = 1, b = 2, c = 1))

# plot the graph
plot(x, y, col.lab ="darkgreen",
           col.axis ="darkgreen")

# plot the graph with new fitting line
# or regression line
lines(x, predict(m))

# saving the file
dev.off()

# print minimum residual or error value
print(sum(resid(m)^2))
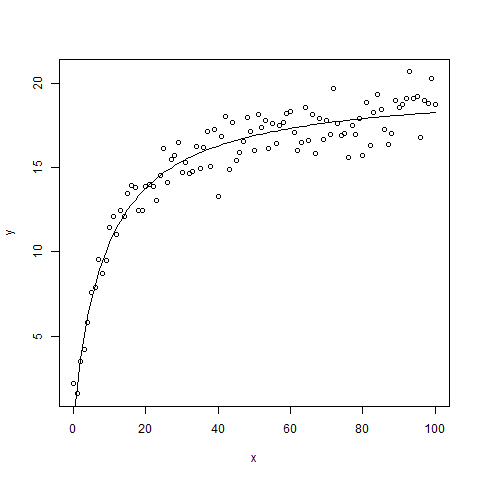
示例 2:
在这个例子中,下面的代码接受一个非线性函数,如下所示:

进一步绘制点和回归线,并使用cor()方法找出拟合优度。
[1] 106.4507输出 :
# creating sequence of 101 values from 0 to 100
x <- seq(0, 100, 1)

y<-((runif(1, 10, 20)*x)/(runif(1, 0, 10) + x)) +
                          rnorm(101, 0, 1)

# output to be present as PNG file
png(file ="nls2.png")

# using starting values in nls() function
# to not get a warning
m<-nls(y~a * x/(b + x), start = list(a = 1, b = 2))

# goodness of fit
cor(y, predict(m))

# minimized residual value
sum(resid(m)^2)

# plotting points on graph
plot(x, y)

# finding regression line
lines(x, predict(m))

# saving the file
dev.off()