在 R 中使用 ggplot2 将误差线添加到折线图
ggplot2是一个 R 语言绘图包,可根据数据框中的数据创建复杂的绘图。它描述了要绘制的变量、它们的显示方式以及一般的视觉属性。它可以在我们的图表中添加误差线、交叉线、线范围、点范围。本文仅致力于向折线图添加误差线。
Syntax: geom_errorbar()
Parameters:
- ymin or xmin : Lower Value of custom point
- ymax or xmax: Upper Value of custom point
- height: height of errorbar
- alpha: Opecity of error bar
- color: Color of error bar
- group: Differentiate points by group
- linetype
- size
可以绘制误差条 通过分别指定 xmin 和 xmax、ymin 和 ymax 来水平或垂直。
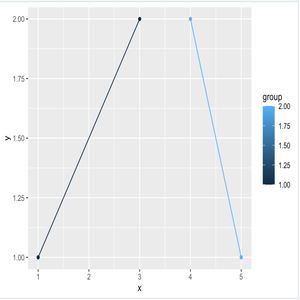
让我们从一个简单的折线图开始
例子:
R
library(ggplot2)
data <- data.frame(
   x = c(1, 5, 3, 4),
   y = c(1, 1, 2, 2),
   group = c(1, 2, 1, 2),
   se = c(0.1, 0.3, 0.3, 0.2))

p <- ggplot(data, aes(x, y, group = group, color=group)) + geom_point() + geom_line()

#output
p
R
library(ggplot2)
data <- data.frame(
   x = c(1, 5, 3, 4),
   y = c(1, 1, 2, 2),
   group = c(1, 2, 1, 2),
   se = c(0.1, 0.3, 0.3, 0.2))

p + geom_errorbarh(aes(xmax = x + se,
                       xmin = x - se,
                       alpha=0.6,
                       height = .4))
R
library(ggplot2)
data <- data.frame(
   x = c(1, 5, 3, 4),
   y = c(1, 1, 2, 2),
   group = c(1, 2, 1, 2),
   se = c(0.1, 0.3, 0.3, 0.2))

#Simple Vertical Errorplot
p + geom_errorbar(aes(ymax = y + se,
                      ymin = y - se))
R
library(ggplot2)
data <- data.frame(
   x = c(1, 5, 3, 4),
   y = c(1, 1, 2, 2),
   group = c(1, 2, 1, 2),
   se = c(0.1, 0.3, 0.3, 0.2))

#Size=10 Vertical Errorplot
p + geom_errorbar(aes(ymax = y + se,
                      ymin = y - se,
                      alpha=0.6,
                      size=10))
R
pd <- position_dodge(0.1)

p+ geom_errorbar(aes(xmin= x-se, xmax= x+se),
                 colour="green",
                 width=.3, position=pd) +
   geom_line(position=pd) +
   geom_point(position=pd, size=3,
                   shape=23, fill="white")
输出:
现在让我们看看如何将误差线添加到折线图中。
方法:
- 导入库
- 创建数据
- 创建情节
- 添加函数以创建具有特定参数的误差条以获得所需的结果。
- 显示图
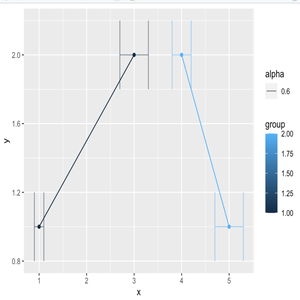
对于 Horizontal Errorplot ,可以使用 geom_errorbarh 并采用与 geom_errorbar 相同的参数,但 xmax 和 xmin 是强制性的。
程序:
电阻
library(ggplot2)
data <- data.frame(
   x = c(1, 5, 3, 4),
   y = c(1, 1, 2, 2),
   group = c(1, 2, 1, 2),
   se = c(0.1, 0.3, 0.3, 0.2))

p + geom_errorbarh(aes(xmax = x + se,
                       xmin = x - se,
                       alpha=0.6,
                       height = .4))
输出:
对于垂直误差图,将 ymin 和 ymax 分配给 geom_errorbar。 size 参数可以改变误差图的宽度,如下所示。
方案一:
电阻
library(ggplot2)
data <- data.frame(
   x = c(1, 5, 3, 4),
   y = c(1, 1, 2, 2),
   group = c(1, 2, 1, 2),
   se = c(0.1, 0.3, 0.3, 0.2))

#Simple Vertical Errorplot
p + geom_errorbar(aes(ymax = y + se,
                      ymin = y - se))
输出:

简单垂直误差图
方案二:
电阻
library(ggplot2)
data <- data.frame(
   x = c(1, 5, 3, 4),
   y = c(1, 1, 2, 2),
   group = c(1, 2, 1, 2),
   se = c(0.1, 0.3, 0.3, 0.2))

#Size=10 Vertical Errorplot
p + geom_errorbar(aes(ymax = y + se,
                      ymin = y - se,
                      alpha=0.6,
                      size=10))
输出:
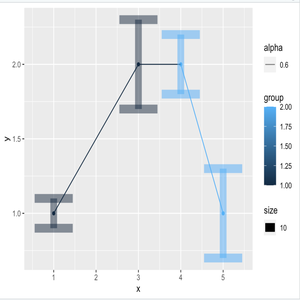
垂直图,大小=10
有时,点在误差栏中重叠。因为position_dodge用于水平移动它们。
程序:
电阻
pd <- position_dodge(0.1)

p+ geom_errorbar(aes(xmin= x-se, xmax= x+se),
                 colour="green",
                 width=.3, position=pd) +
   geom_line(position=pd) +
   geom_point(position=pd, size=3,
                   shape=23, fill="white")
输出:
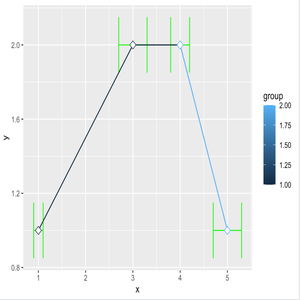
形状=23