Python中的 Matplotlib.patches.RegularPolygon 类
Matplotlib是Python中用于数组二维图的惊人可视化库。 Matplotlib 是一个基于 NumPy 数组构建的多平台数据可视化库,旨在与更广泛的 SciPy 堆栈配合使用。
matplotlib.patches.RegularPolygon
matplotlib.patches.RegularPolygon 类用于添加正多边形补丁。
Syntax: class matplotlib.patches.RegularPolygon(xy, numVertices, radius=5, orientation=0, **kwargs)
Parameters:
- xy: A length 2 tuple (x, y) of the center.
- numVertices: It represents the number of vertices.
- radius: The distance from the center to each of the vertices.
- orientation: It is used to rotate the polygon (in radians).
下表列出了有效的 kwargs;PROPERTY DESCRIPTION agg_filter a filter function that takes a (m, n, 3) float array and a dpi value that returns a (m, n, 3) array alpha float or None animated bool antialiased or aa unknown capstyle {‘butt’, ’round’, ‘projecting’} clip_box Bbox clip_on bool clip_path [(Path, Transform)|Patch|None] color color or sequence of rgba tuples contains callable edgecolor or ec or edgecolors color or None or ‘auto’ facecolor or fc or facecolors color or None figure figure fill bool gid str hatch {‘/’, ‘\’, ‘|’, ‘-‘, ‘+’, ‘x’, ‘o’, ‘O’, ‘.’, ‘*’} in_layout bool joinstyle {‘miter’, ’round’, ‘bevel’} linestyle or ls {‘-‘, ‘–‘, ‘-.’, ‘:’, ”, (offset, on-off-seq), …} linewidth or linewidths or lw float or None path_effects AbstractPathEffect picker None or bool or float or callable path_effects AbstractPathEffect picker float or callable[[Artist, Event], Tuple[bool, dict]] rasterized bool or None sketch_params (scale: float, length: float, randomness: float) snap bool or None transform matplotlib.transforms.Transform url str visible bool zorder float
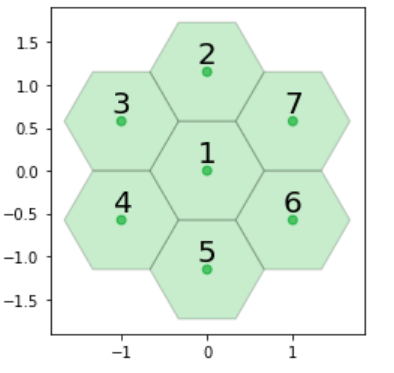
示例 1:
Python3
import matplotlib.pyplot as plt
from matplotlib.patches import RegularPolygon
import numpy as np


coord = [[0, 0, 0],
         [0, 1, -1],
         [-1, 1, 0],
         [-1, 0, 1],
         [0, -1, 1],
         [1, -1, 0],
         [1, 0, -1]]

colors = [["Green"],
          ["Green"],
          ["Green"],
          ["Green"],
          ["Green"],
          ["Green"],
          ["Green"]]

labels = [['1'], ['2'],
          ['3'], ['4'],
          ['5'], ['6'],
          ['7']]

# Horizontal cartesian coords
hcoord = for c in coord]

# Vertical cartersian coords
vcoord = [2. * np.sin(np.radians(60)) * (c[1] - c[2]) /3.
          for c in coord]

fig, ax = plt.subplots(1)
ax.set_aspect('equal')

# Add some coloured hexagons
for x, y, c, l in zip(hcoord, vcoord, colors, labels):

    # matplotlib understands lower
    # case words for colours
    color = c[0].lower()
    hex = RegularPolygon((x, y),
                         numVertices = 6,
                         radius = 2. / 3.,
                         orientation = np.radians(30),
                         facecolor = color,
                         alpha = 0.2,
                         edgecolor ='k')

    ax.add_patch(hex)

    # Also add a text label
    ax.text(x, y + 0.2, l[0], ha ='center',
            va ='center', size = 20)

# add scatter points in hexagon centers
ax.scatter(hcoord, vcoord, c =.lower()
                               for c in colors],
           alpha = 0.5)

plt.show()
Python3
import matplotlib.pyplot as plt
from matplotlib.patches import RegularPolygon
from matplotlib.collections import PatchCollection
import numpy as np


xy = np.random.random((10, 2))
z = np.random.random(10)

patches = [RegularPolygon((x, y),
                          5, 0.1)
           for x, y in xy]

collection = PatchCollection(patches,
                             array = z,
                             edgecolors ='brown',
                             lw = 2)

fig, ax = plt.subplots()

ax.patch.set(facecolor ='green')
ax.add_collection(collection)
ax.autoscale()

plt.show()
输出:
示例 2:
Python3
import matplotlib.pyplot as plt
from matplotlib.patches import RegularPolygon
from matplotlib.collections import PatchCollection
import numpy as np


xy = np.random.random((10, 2))
z = np.random.random(10)

patches = [RegularPolygon((x, y),
                          5, 0.1)
           for x, y in xy]

collection = PatchCollection(patches,
                             array = z,
                             edgecolors ='brown',
                             lw = 2)

fig, ax = plt.subplots()

ax.patch.set(facecolor ='green')
ax.add_collection(collection)
ax.autoscale()

plt.show()
输出:
