Python中的 Matplotlib.patches.CirclePolygon 类
Matplotlib是Python中用于数组二维图的惊人可视化库。 Matplotlib 是一个基于 NumPy 数组构建的多平台数据可视化库,旨在与更广泛的 SciPy 堆栈配合使用。
matplotlib.patches.CirclePolygon
matplotlib.patches.CirclePolygon类用于圆形补丁的多边形近似。它用于在xy = (x, y)处创建一个具有已提供半径的圆。具有分辨率边的正多边形近似于该圆。
Syntax: class matplotlib.patches.CirclePolygon(xy, radius=5, resolution=20, **kwargs)
Parameters:
- xy: The origin coordinate of the circle to be drawn.
- radius: It’s an optional parameter that is used to set the radius of the circle.It defaults to 5 units.
- resolution: As the name suggest it is used to set the image resolution. It is optional and defaults to 20.
下表提供了可选的有效 kwargs ;
| PROPERTY | DESCRIPTION |
|---|---|
| agg_filter | a filter function that takes a (m, n, 3) float array and a dpi value that returns a (m, n, 3) array |
| alpha | float or None |
| animated | bool |
| antialiased or aa | unknown |
| capstyle | {‘butt’, ’round’, ‘projecting’} |
| clip_box | Bbox |
| clip_on | bool |
| clip_path | [(Path, Transform)|Patch|None] |
| color | color or sequence of rgba tuples |
| contains | callable |
| edgecolor or ec or edgecolors | color or None or ‘auto’ |
| facecolor or fc or facecolors | color or None |
| figure | figure |
| fill | bool |
| gid | str |
| hatch | {‘/’, ‘\’, ‘|’, ‘-‘, ‘+’, ‘x’, ‘o’, ‘O’, ‘.’, ‘*’} |
| in_layout | bool |
| joinstyle | {‘miter’, ’round’, ‘bevel’} |
| linestyle or ls | {‘-‘, ‘–‘, ‘-.’, ‘:’, ”, (offset, on-off-seq), …} |
| linewidth or linewidths or lw | float or None |
| path_effects | AbstractPathEffect |
| picker | None or bool or float or callable |
| path_effects | AbstractPathEffect |
| picker | float or callable[[Artist, Event], Tuple[bool, dict]] |
| rasterized | bool or None |
| sketch_params | (scale: float, length: float, randomness: float) |
| snap | bool or None |
| transform | matplotlib.transforms.Transform |
| url | str |
| visible | bool |
| zorder | float |
示例 1:
import matplotlib.pyplot as plt
from matplotlib.patches import CirclePolygon


circle = CirclePolygon((0, 0),
                       radius = 0.75,
                       fc = 'y')

plt.gca().add_patch(circle)

verts = circle.get_path().vertices
trans = circle.get_patch_transform()
points = trans.transform(verts)

plt.plot(points[:, 0], points[:, 1])
plt.axis('scaled')

plt.show()
输出: 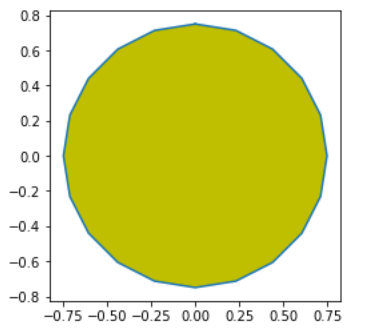
示例 2:
import numpy as np
import matplotlib
from matplotlib.patches import Circle, Wedge, Polygon, Ellipse
from matplotlib.collections import PatchCollection
import matplotlib.pyplot as plt
import matplotlib.patches as matpatches


fig, ax = plt.subplots(figsize =(8, 8))
patches = []


circle = Circle((2, 2), 2)
patches.append(circle)


polygon = matpatches.PathPatch(patches[0].get_path())
patches.append(polygon)


colors = 2 * np.random.rand(len(patches))
p = PatchCollection(patches,
                    cmap = matplotlib.cm.jet,
                    alpha = 0.4)

p.set_array(np.array(colors))
ax.add_collection(p)

plt.axis([-10, 10, -10, 10])

plt.show()
输出: 