📌 相关文章
- matplotlib - Python (1)
- matplotlib 中的图 - Python (1)
- python matplotlib - Python (1)
- matplotlib 中的图 - Python 代码示例
- matplotlib - Python 代码示例
- Matplotlib-饼图
- Matplotlib-饼图(1)
- python matplotlib - Python 代码示例
- 在 python 中使用 matplotlib(1)
- matplotlib 3.0.3 轮文件 - Python (1)
- 在 python 代码示例中使用 matplotlib
- matplotlib 安装 - Python (1)
- matplotlib 3.0.3 轮文件 - Python 代码示例
- matplotlib 矩阵图 - Python (1)
- matplotlib 安装 - Python 代码示例
- 安装 matplotlib - Python 代码示例
- matplotlib 轴标签 - Python (1)
- matplotlib 点标签 - Python (1)
- 如何在Python安装Matplotlib
- 如何在Python安装Matplotlib(1)
- python install matplotlib - Python 代码示例
- matplotlib 暗模式 - Python (1)
- 导入 matplotlib python (1)
- matplotlib 矩阵图 - Python 代码示例
- Python| Matplotlib 简介
- Python| Matplotlib 简介(1)
- matplotlib 轴标签 - Python 代码示例
- matplotlib 点标签 - Python 代码示例
- 关闭轴 matplotlib - Python (1)
📜 Python -Matplotlib
📅 最后修改于: 2020-12-13 14:11:26 🧑 作者: Mango
Matplotlib是一个Python库,用于通过使用Python脚本创建2D图形和绘图。它有一个名为pyplot的模块,通过提供控制线条样式,字体属性,格式轴等功能,使绘图变得容易。它支持多种图形和绘图,即-直方图,条形图,功率谱,误差图等。它与NumPy一起使用,以提供一种环境,该环境是MatLab的有效开源替代方案。它也可以与PyQt和wxPython等图形工具包一起使用。
按照惯例,通过添加以下语句将包导入到Python脚本中-
from matplotlib import pyplot as plt
Matplotlib示例
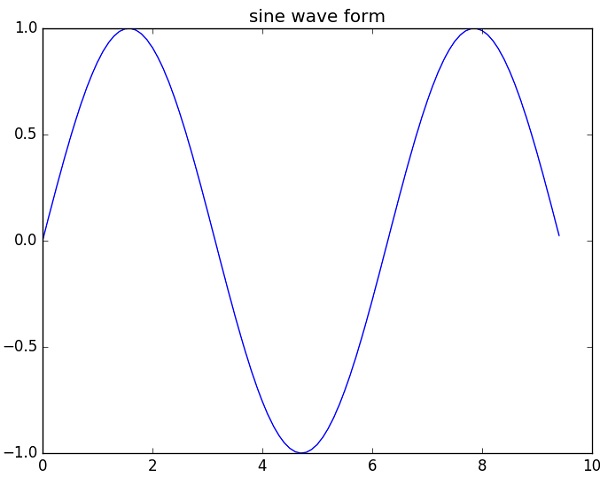
以下脚本使用matplotlib生成正弦波图。
例
import numpy as np
import matplotlib.pyplot as plt

# Compute the x and y coordinates for points on a sine curve
x = np.arange(0, 3 * np.pi, 0.1)
y = np.sin(x)
plt.title("sine wave form")

# Plot the points using matplotlib
plt.plot(x, y)
plt.show()
其输出如下-
在下一章中,我们将在数据科学工作中看到许多有关使用Matplotlib Python库的示例。