Python中的 Matplotlib.patches.ArrowStyle 类
Matplotlib是Python中用于数组二维图的惊人可视化库。 Matplotlib 是一个基于 NumPy 数组构建的多平台数据可视化库,旨在与更广泛的 SciPy 堆栈配合使用。
matplotlib.patches.ArrowStyle
matplotlib.patches.ArrowStyle类是一个容器类,它定义了许多箭头样式类,用于沿着提供的路径创建箭头路径。这些主要与 FancyArrowpatch 一起使用。
Syntax: class matplotlib.patches.ArrowStyle
以下子类是为各种箭头样式定义的;
| Class | Name | Attributes |
|---|---|---|
| Curve | – | None |
| CurveB | -> | head_length=0.4, head_width=0.2 |
| BracketB | -[ | widthB=1.0, lengthB=0.2, angleB=None |
| CurveFilledB | -|> | head_length=0.4, head_width=0.2 |
| CurveA | <- | head_length=0.4, head_width=0.2 |
| CurveAB | <-|> | head_length=0.4, head_width=0.2 |
| CurveFilledA | <|- | head_length=0.4, head_width=0.2 |
| CurveFilledAB | <|-|> | head_length=0.4, head_width=0.2 |
| BracketA | ]- | widthA=1.0, lengthA=0.2, angleA=None |
| BracketAB | ]-[ | widthA=1.0, lengthA=0.2, angleA=None, widthB=1.0, lengthB=0.2, angleB=None |
| Fancy | fancy | head_length=0.4, head_width=0.4, tail_width=0.4 |
| Simple | simple | head_length=0.5, head_width=0.5, tail_width=0.2 |
| Wedge | wedge | tail_width=0.3, shrink_factor=0.5 |
| BarAB | |-| | widthA=1.0, angleA=None, widthB=1.0, angleB=None |
示例 1:
import matplotlib.pyplot as plt
from matplotlib.patches import ArrowStyle

plt.figure(1, figsize =(9, 9))

ArrowStyle("Wedge")

ax = plt.subplot(111)

ax.annotate("",
            xy =(0.2, 0.2), xycoords ='data',
            xytext =(0.8, 0.8), textcoords ='data',
            arrowprops = dict(arrowstyle ="Wedge",
                            connectionstyle ="arc3"),
            )

plt.show()
输出: 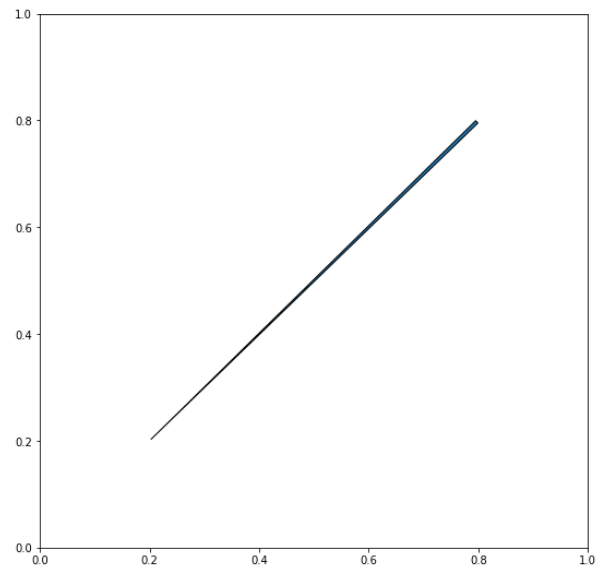
示例 2:
import matplotlib.patches as mpatch
import matplotlib.pyplot as plt


figheight = 8
fig = plt.figure(figsize =(9, figheight), dpi = 80)
fontsize = 0.4 * fig.dpi

def make_boxstyles(ax):
    styles = mpatch.BoxStyle.get_styles()

    for i, (stylename, styleclass) in enumerate(sorted(styles.items())):
        ax.text(0.5,
                (float(len(styles)) - 0.5 - i)/len(styles),
                stylename,
                ha ="center",
                size = fontsize,
                transform = ax.transAxes,
                bbox = dict(boxstyle = stylename,
                            fc ="g", ec ="r"))

def make_arrowstyles(ax):
    styles = mpatch.ArrowStyle.get_styles()

    ax.set_xlim(0, 4)
    ax.set_ylim(0, figheight)

    for i, (stylename, styleclass) in enumerate(sorted(styles.items())):

        # /figheight
        y = (float(len(styles)) - 0.25 - i
        p = mpatch.Circle((3.2, y), 0.2, fc ="r")
        ax.add_patch(p)

        ax.annotate(stylename, (3.2, y),
                    (2., y),

                    # xycoords ="figure fraction",
                    # textcoords ="figure fraction",
                    ha ="right", va ="center",
                    size = fontsize,
                    arrowprops = dict(arrowstyle = stylename,
                                    patchB = p,
                                    shrinkA = 5,
                                    shrinkB = 5,
                                    fc ="w", ec ="r",
                                    connectionstyle ="arc3, rad =-0.05",
                                    ),
                    bbox = dict(boxstyle ="square", fc ="g"))

    ax.xaxis.set_visible(False)
    ax.yaxis.set_visible(False)


ax1 = fig.add_subplot(121, frameon = False, xticks =[], yticks =[])
make_boxstyles(ax1)

ax2 = fig.add_subplot(122, frameon = False, xticks =[], yticks =[])
make_arrowstyles(ax2)


plt.show()
输出: 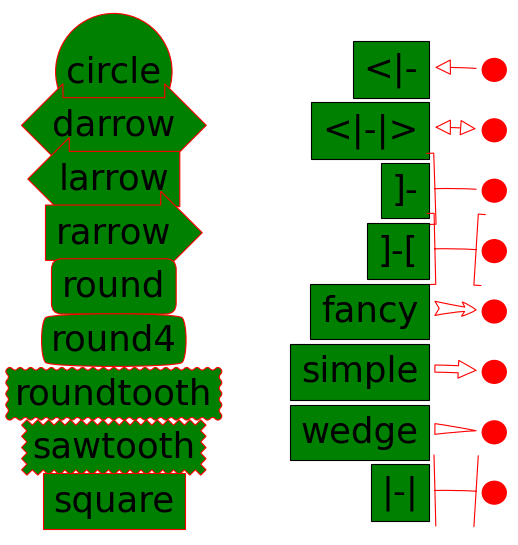
在评论中写代码?请使用 ide.geeksforgeeks.org,生成链接并在此处分享链接。