使用 Matplotlib 绘制样式图
Matplotlib 是Python中最流行的包或库,用于数据可视化。通过使用这个库,我们可以生成绘图和图形,并且可以在不使用任何其他 GUI 的情况下轻松创建光栅和矢量文件。使用 matplotlib,我们可以对绘图进行样式设置,例如使用 CSS 样式设置 HTML 网页的样式。我们只需要导入 matplotlib 库的样式包。
style包内有多种内置样式,我们也可以编写自定义样式文件,然后使用这些样式,只需导入它们并应用于图形和绘图。通过这种方式,我们不需要一次又一次地为每个图单独编写不同的代码行,即代码可以在需要时重复使用。
首先,我们将导入模块:
from matplotlib import style列出所有可用的样式:
Python3
from matplotlib import style

print(plt.style.available)
Python3
# importing all the necessary packages
import numpy as np
import matplotlib.pyplot as plt

# importing the style package
from matplotlib import style

# creating an array of data for plot
data = np.random.randn(50)

# using the style for the plot
plt.style.use('Solarize_Light2')

# creating a plot
plt.plot(data)

# show plot
plt.show()
Python3
# importing all the necessary packages
import numpy as np
import matplotlib.pyplot as plt

# importing the style package
from matplotlib import style

# creating an array of data for plot
data = np.random.randn(50)

# using the style for the plot
plt.style.use('dark_background')

# creating a plot
plt.plot(data)

# show plot
plt.show()
Python3
# importing all the necessary packages
import numpy as np
import matplotlib.pyplot as plt

# importing the style package
from matplotlib import style

# creating an array of data for plot
data = np.random.randn(50)

# using the style for the plot
plt.style.use('ggplot')

# creating plot
plt.plot(data, linestyle=":", linewidth=2)

# show plot
plt.show()
Python3
# importing all the necessary packages
import numpy as np
import matplotlib.pyplot as plt

# importing the style package
from matplotlib import style

with plt.style.context('dark_background'):
    plt.plot(np.sin(np.linspace(0, 2 * np.pi)), 'r-o')

plt.show()
输出:
[‘Solarize_Light2’, ‘_classic_test_patch’, ‘bmh’, ‘classic’, ‘dark_background’, ‘fast’, ‘fivethirtyeight’, ‘ggplot’,’grayscale’,’seaborn’,’seaborn-bright’,’seaborn-colorblind’, ‘seaborn-dark’, ‘seaborn-dark-palette’, ‘seaborn-darkgrid’, ‘seaborn-deep’, ‘seaborn-muted’, ‘seaborn-notebook’, ‘seaborn-paper’, ‘seaborn-pastel’, ‘seaborn-poster’,’seaborn-talk’,’seaborn-ticks’,’seaborn-white’,’seaborn-whitegrid’,’tableau-colorblind10′]
以上是包中可用的样式列表。
Syntax: plt.style.use(‘style_name”)
其中 style_name 是我们要使用的样式的名称。
方法:
- 导入模块。
- 为绘图创建数据。
- 使用要添加到绘图中的样式。
- 创建一个情节。
- 显示情节。
示例 1:
蟒蛇3
# importing all the necessary packages
import numpy as np
import matplotlib.pyplot as plt

# importing the style package
from matplotlib import style

# creating an array of data for plot
data = np.random.randn(50)

# using the style for the plot
plt.style.use('Solarize_Light2')

# creating a plot
plt.plot(data)

# show plot
plt.show()
输出:

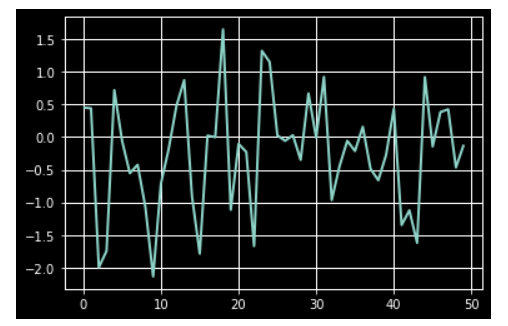
示例 2:
蟒蛇3
# importing all the necessary packages
import numpy as np
import matplotlib.pyplot as plt

# importing the style package
from matplotlib import style

# creating an array of data for plot
data = np.random.randn(50)

# using the style for the plot
plt.style.use('dark_background')

# creating a plot
plt.plot(data)

# show plot
plt.show()
输出:
示例 3:
蟒蛇3
# importing all the necessary packages
import numpy as np
import matplotlib.pyplot as plt

# importing the style package
from matplotlib import style

# creating an array of data for plot
data = np.random.randn(50)

# using the style for the plot
plt.style.use('ggplot')

# creating plot
plt.plot(data, linestyle=":", linewidth=2)

# show plot
plt.show()
输出:

注意:如果您只想为特定绘图使用样式但不想更改所有绘图的全局样式,则样式包提供了一个上下文管理器,用于限制特定绘图的样式区域。为了改变情节的风格,我们可以写这样的东西。
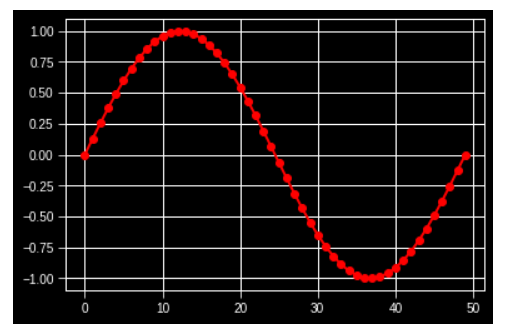
示例 4:
蟒蛇3
# importing all the necessary packages
import numpy as np
import matplotlib.pyplot as plt

# importing the style package
from matplotlib import style

with plt.style.context('dark_background'):
    plt.plot(np.sin(np.linspace(0, 2 * np.pi)), 'r-o')

plt.show()
输出: