在 R 中并排创建多个条形图
在 R 编程语言中,条形图是一维线性数据的图形表示。条形图用于统计分析,以便于理解数据。它以条形图的形式表示给定的数据。它可以给出沿 x 轴和 y 轴的条形图。其中 x 轴表示数据的名称,y 轴表示 0 到 n 范围内的条形图值。
在本文中,我们将在 R 编程中并排创建多个条形图。如果我们想并排创建多个条形图,那么我们必须在上述语法中指定参数,即 beside=T。它将指定 True。这会将第二个,第三个,.,以此类推到下一个条形图
语法:
barplot(data,beside=T)
哪里,旁边是并排放置条形图
因此,要并排绘制多个条形图,每个条形图的数据将使用 cbind() 进行初始化和组合。然后它实际上是使用 barplot() 绘制的,旁边设置为 TRUE(T)。
示例 1:
R
# college1 vector
college1=c(98,89,89.0,78,98,89)

# college2 vector
college2=c(88,91,100,78,98,80)

# combine two vectors using cbind
# function
college_data=cbind(college1,college2)

# pass this college_data to the
# barplot
barplot(college_data,beside=T)
R
# college1 vector
college1=c(98,89,89.0,78,98,89)

# college2 vector
college2=c(88,91,100,78,98,80)

# college3 vector
college3=c(98,89,89.0,100,67,56)


# combine three college vectors
# using cbind function
college_data=cbind(college1,college2,college3)

# pass this college_data to the barplot
barplot(college_data,beside=T)
输出:

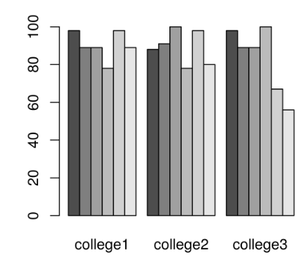
示例 2:
电阻
# college1 vector
college1=c(98,89,89.0,78,98,89)

# college2 vector
college2=c(88,91,100,78,98,80)

# college3 vector
college3=c(98,89,89.0,100,67,56)


# combine three college vectors
# using cbind function
college_data=cbind(college1,college2,college3)

# pass this college_data to the barplot
barplot(college_data,beside=T)
输出: