使用Python进行数据分析和可视化 |设置 2
先决条件: Python中的 NumPy,使用Python进行数据分析可视化 |设置 1
1. 以 CSV 格式存储 DataFrame:
Pandas提供to.csv('filename', index = "False|True")函数将 DataFrame 写入 CSV 文件。这里filename是您要创建的 CSV 文件的名称, index告诉 DataFrame 的索引(如果默认)是否应该被覆盖。如果我们设置index = False那么索引不会被覆盖。默认情况下,索引的值为TRUE ,然后索引被覆盖。
例子 :
import pandas as pd

# assigning three series to s1, s2, s3
s1 = pd.Series([0, 4, 8])
s2 = pd.Series([1, 5, 9])
s3 = pd.Series([2, 6, 10])

# taking index and column values
dframe = pd.DataFrame([s1, s2, s3])

# assign column name
dframe.columns =['Geeks', 'For', 'Geeks']

# write data to csv file
dframe.to_csv('geeksforgeeks.csv', index = False)
dframe.to_csv('geeksforgeeks1.csv', index = True)
输出 :
geeksforgeeks1.csv 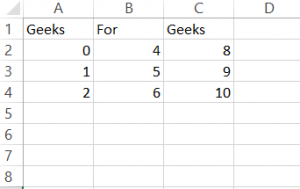 geeksforgeeks2.csv
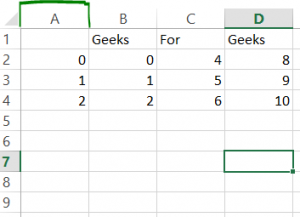
2. 处理缺失数据
数据分析阶段还包括处理数据集中缺失数据的能力,Pandas 也达到了这一预期也就不足为奇了。这就是dropna和/或fillna方法发挥作用的地方。在处理缺失数据时,作为数据分析师,您要么应该删除包含NaN 值的列(dropna 方法),要么用整列条目的平均值或众数填充缺失数据(fillna 方法),这个决定是意义重大,取决于数据和影响将在我们的结果中产生。
- 删除丢失的数据:
考虑这是由以下代码生成的 DataFrame: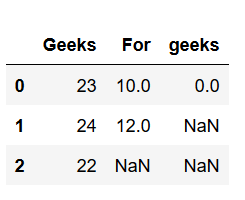
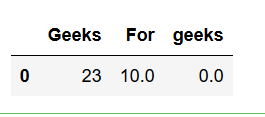
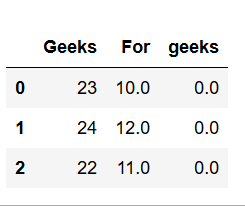
import pandas as pd

# Create a DataFrame
dframe = pd.DataFrame({'Geeks': [23, 24, 22],
                       'For': [10, 12, np.nan],
                       'geeks': [0, np.nan, np.nan]},
                       columns =['Geeks', 'For', 'geeks'])

# This will remove all the
# rows with NAN values

# If axis is not defined then
# it is along rows i.e. axis = 0
dframe.dropna(inplace = True)
print(dframe)

# if axis is equal to 1
dframe.dropna(axis = 1, inplace = True)

print(dframe)
输出 :
轴=0
 轴=1
轴=1 
- 填写缺失值:
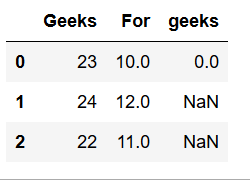
现在,要用数据的平均值或模式替换任何NaN值,使用fillna,它可以根据要求替换特定列甚至整个DataFrame中的所有 NaN 值。import numpy as np import pandas as pd # Create a DataFrame dframe = pd.DataFrame({'Geeks': [23, 24, 22], 'For': [10, 12, np.nan], 'geeks': [0, np.nan, np.nan]}, columns = ['Geeks', 'For', 'geeks']) # Use fillna of complete Dataframe # value function will be applied on every column dframe.fillna(value = dframe.mean(), inplace = True) print(dframe) # filling value of one column dframe['For'].fillna(value = dframe['For'].mean(), inplace = True) print(dframe)输出 :
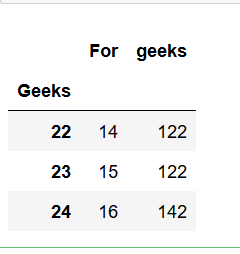
3. Groupby 方法(聚合):
groupby 方法允许我们根据任何行或列将数据分组在一起,因此我们可以进一步应用聚合函数来分析我们的数据。使用映射器(字典或键函数,将给定函数应用于组,将结果作为系列返回)或一系列列对系列进行分组。
考虑这是由以下代码生成的 DataFrame: 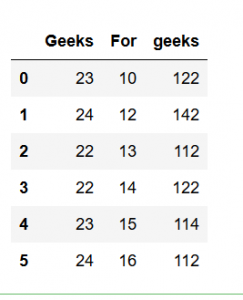
import pandas as pd
import numpy as np

# create DataFrame
dframe = pd.DataFrame({'Geeks': [23, 24, 22, 22, 23, 24],
                        'For': [10, 12, 13, 14, 15, 16],
                        'geeks': [122, 142, 112, 122, 114, 112]},
                        columns = ['Geeks', 'For', 'geeks'])

# Apply groupby and aggregate function
# max to find max value of column

# "For" and column "geeks" for every
# different value of column "Geeks".

print(dframe.groupby(['Geeks']).max())
输出 :