📌 相关文章
- MATLAB 2D fill()(1)
- MATLAB 2D fill()
- MATLAB 2D area()
- MATLAB 2D Bar()
- MATLAB 2D Bar()(1)
- c++ 代码 2d 块 - C++ (1)
- MATLAB 2D Pie()(1)
- MATLAB 2D Pie()
- MATLAB 2D hist()(1)
- MATLAB 2D hist()
- MATLAB 2D barh()(1)
- MATLAB 2D barh()
- MATLAB 2D quiver()
- MATLAB 2D quiver()(1)
- MATLAB 2-D图
- MATLAB 2-D图(1)
- 根 matlab (1)
- MATLAB中的饼图
- matlab 轴 - Matlab (1)
- : 在 matlab (1)
- MATLAB中的饼图(1)
- MATLAB 2D stem()
- MATLAB 2D stem()(1)
- MATLAB 2D loglog()
- MATLAB 2D loglog()(1)
- MATLAB 2D errorbar()(1)
- MATLAB 2D Semilogx()
- MATLAB 2D errorbar()
- MATLAB 2D Semilogx()(1)
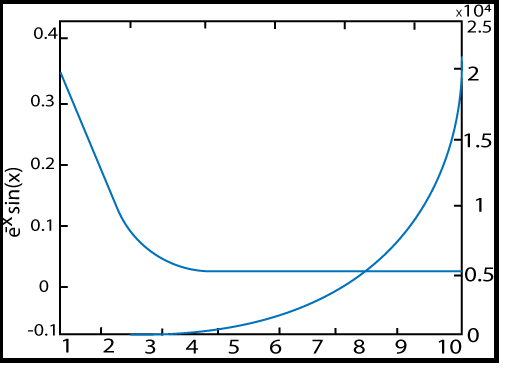
📜 MATLAB 2D plotyy()
📅 最后修改于: 2021-01-07 02:38:46 🧑 作者: Mango
MATLAB plotyy()
它创建在左侧和右侧均带有y轴的图形。
句法
plotyy(X1,Y1,X2,Y2) //   It plots X1 versus Y1 with y-axis label on the left and plot X2 versus Y2 with y-axis labeling on the right.
plotyy(X1,Y1,X2,Y2,'function') // It uses the plotting function specified by the string 'function' instead of plot to produce each graph. 'function' can be plot, semilogx, semilogy,stem,loglog etc.
plotyy(X1, Y1,X2,Y2,'function1','function2') // It uses function1(X1, Y1) to plot the information for the left-axis and function2(X2,Y2) to plot the information for the right axis.
[AX, H1, H2] = plotyy(...) // It returns the handles of the two axes generated in AX and the handle of the graphics objects from each plots in H1 and H2. AX (1) is a left axes and AX (2) is a right axes.
例
y_1=e^-x sinx,0≤t≤10
y_2=e^x
x= 1:1:10;
y1=exp(-x).*sin(x);
y2=exp(x);
Ax=plotyy(x, y1, x, y2);
hy1=get(Ax(1),'ylabel');
hy2= get(Ax(2),'ylabel');
set(hy1,'string','e^-x sin(x)');
set(hy2,'string',' e^ x');
输出: