📌 相关文章
- MATLAB 2D fill()(1)
- MATLAB 2D fill()
- MATLAB 2D area()
- 如何在 google bar chart 的 bar 上添加链接 - Html 代码示例
- PHPself::$bar 和 static::$bar 的区别(1)
- PHPself::$bar 和 static::$bar 的区别
- c++ 代码 2d 块 - C++ (1)
- MATLAB 2D Pie()
- MATLAB 2D Pie()(1)
- C图形中的bar()函数
- C图形中的bar()函数(1)
- \ bar-Tex命令
- MATLAB 2D hist()(1)
- MATLAB 2D hist()
- MATLAB 2D barh()(1)
- MATLAB 2D barh()
- MATLAB 2D quiver()(1)
- MATLAB 2D quiver()
- MATLAB中的饼图(1)
- : 在 matlab (1)
- 根 matlab (1)
- MATLAB中的饼图
- MATLAB 2-D图
- matlab 轴 - Matlab (1)
- MATLAB 2-D图(1)
- MATLAB 2D stem()(1)
- MATLAB 2D stem()
- MATLAB 2D Semilogx()(1)
- MATLAB 2D errorbar()
📜 MATLAB 2D Bar()
📅 最后修改于: 2021-01-07 02:36:02 🧑 作者: Mango
MATLAB Bar()
条形图是其中每个点都由垂直条或水平条表示的图。
句法
bar(y) // It creates a bar graph with one bar for each element in y.
bar (x, y) // This function creates a vertical bar plot, with the values in x used to label each bar and the values in y used to determine the height of the bar.
例
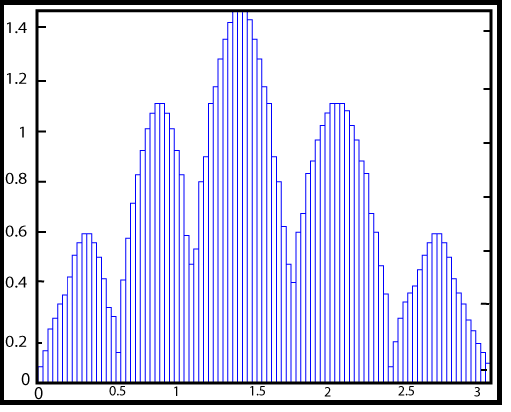
创建条形图
r^2=2 sin 5t, 0≤t≤2π
y = r sin t
t=linspace (0, 2*pi,200);
r=sqrt(abs(2*sin(5*t)));
y=r.*sin(t);
bar (t, y)
axis ([0 pi 0 inf]);
输出: