饼图是分为多个部分的圆形图,每个部分代表整体的比例部分。在MATLAB中,我们有一个名为pie()的函数,该函数使我们能够绘制条形图。
句法:
pie(X)
pie(X) draws a pie chart using the data in X. Each slice of the pie chart represents an element in X.
- Where the sum(X) ≤ 1, then the areas of the pie slices directly specify the values in X pie draws only a partial pie if sum(X) < 1.
- Where the sum(X) > 1, then the area of each slice of the pie is determined by pie normalizes the values by X/sum(X)
- Here let X be a categorical data type, the slices correspond to categories. The number of elements in the category divided by the number of elements in X becomes The area of each slice.
现在让我们来看一些例子。
示例1:一个简单的饼图:
MATLAB
% data
b= [20 30 40 30]

% pie function to draw pie chart
pie(b)
MATLAB
% data
b= [20 30 40 30]
% offset first and third by using 1 at explode
explode = [1 0 1 0]

% pie function to draw pie chart with
% explode 1st and 3rd position data
pie(b,explode)
MATLAB
% data
b= [20 30 40 30]

% labelling on Pie chart
labels={'a','b','c','d'}

% pie function to draw pie chart with labels
pie(b,labels)
MATLAB
% create vector whose sum is less than 1
b= [0.2 0.4 0.1]

% pie function to draw pie chart
pie(b)
MATLAB
% data
b= [20 30 40 30]
a= [10 40 20 20]

% labelling on pie chart
labels={'a','b','c','d'}

% to add more than 1 plot in same figure
t = tiledlayout(1,2,'TileSpacing','compact');

% create pie charts
ax1 = nexttile;
pie(ax1,a)
title('Pie chart 1')
ax2 = nexttile;
pie(ax2,b)
title('Pie chart 2')

% create legend and put labels as arguments
lgd = legend(labels);
% position of legend there are 4 positions
%'north','south','east','west'
lgd.Layout.Tile = 'north';
输出 :
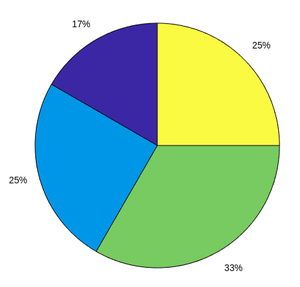
图1:饼图
示例2:具有偏移量的饼图:
的MATLAB
% data
b= [20 30 40 30]
% offset first and third by using 1 at explode
explode = [1 0 1 0]

% pie function to draw pie chart with
% explode 1st and 3rd position data
pie(b,explode)
输出 :
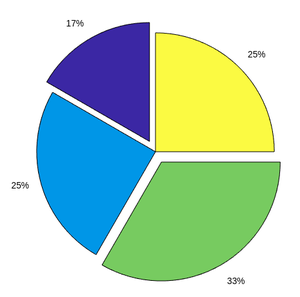
无花果2:带有偏移量的饼图
示例3:带有标签的饼图:
的MATLAB
% data
b= [20 30 40 30]

% labelling on Pie chart
labels={'a','b','c','d'}

% pie function to draw pie chart with labels
pie(b,labels)
输出 :
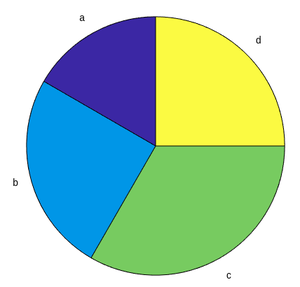
图3:带有标签的饼图
示例4:部分饼图:
的MATLAB
% create vector whose sum is less than 1
b= [0.2 0.4 0.1]

% pie function to draw pie chart
pie(b)
输出 :
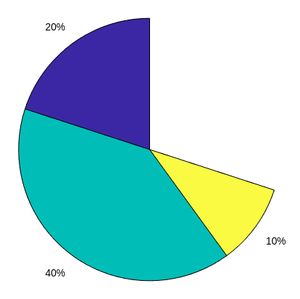
图4:局部饼图
示例5:比较2个饼图:
的MATLAB
% data
b= [20 30 40 30]
a= [10 40 20 20]

% labelling on pie chart
labels={'a','b','c','d'}

% to add more than 1 plot in same figure
t = tiledlayout(1,2,'TileSpacing','compact');

% create pie charts
ax1 = nexttile;
pie(ax1,a)
title('Pie chart 1')
ax2 = nexttile;
pie(ax2,b)
title('Pie chart 2')

% create legend and put labels as arguments
lgd = legend(labels);
% position of legend there are 4 positions
%'north','south','east','west'
lgd.Layout.Tile = 'north';
输出 :
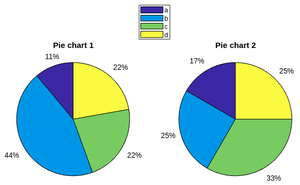
图5:两个饼图的比较