📌 相关文章
- 将颜色条添加到 2d hist - Python (1)
- 将颜色条添加到 2d hist - Python 代码示例
- Pandas DataFrame.hist()
- Pandas DataFrame.hist()(1)
- Python中的 Pandas.DataFrame.hist()函数
- Python中的 Pandas.DataFrame.hist()函数(1)
- MATLAB 2D fill()(1)
- MATLAB 2D fill()
- Python中的 Matplotlib.pyplot.hist()
- Python中的 Matplotlib.pyplot.hist()(1)
- pandas 数据框 hist 标题 - Python (1)
- MATLAB 2D area()
- MATLAB 2D Bar()(1)
- MATLAB 2D Bar()
- pandas 数据框 hist 标题 - Python 代码示例
- c++ 代码 2d 块 - C++ (1)
- MATLAB 2D Pie()
- MATLAB 2D Pie()(1)
- python matplotlib hist 设置轴范围 - Python (1)
- python matplotlib hist 设置轴范围 - Python 代码示例
- MATLAB 2D barh()(1)
- MATLAB 2D barh()
- MATLAB 2D quiver()
- MATLAB 2D quiver()(1)
- MATLAB 2-D图
- matlab 轴 - Matlab (1)
- 根 matlab (1)
- MATLAB中的饼图
- : 在 matlab (1)
📜 MATLAB 2D hist()
📅 最后修改于: 2021-01-07 02:41:25 🧑 作者: Mango
MATLAB hist()
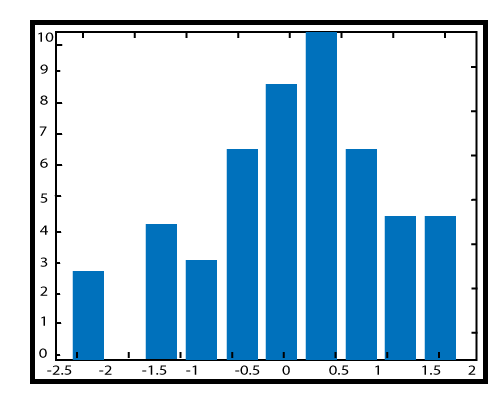
直方图是表示数据集中值分布的曲线图。为了生成直方图,将数据集中的值范围划分为均匀分布的bin,并确定落入每个bin中的数据值的数量。
句法
n=hist(y) // It bins the elements in vector y into ten equally spaced containers and returns the number of items in each container as a row vector.
例
Histogram of 50 randomly distributed numbers between 0 and 1.
y=randn (50, 1);
hist (y)
输出: