📌 相关文章
- Python中的 Matplotlib.pyplot.stem()
- Python中的 Matplotlib.pyplot.stem()(1)
- MATLAB 2D fill()(1)
- MATLAB 2D fill()
- MATLAB 2D area()
- MATLAB 2D Bar()(1)
- MATLAB 2D Bar()
- c++ 代码 2d 块 - C++ (1)
- MATLAB 2D Pie()(1)
- MATLAB 2D Pie()
- MATLAB 2D hist()(1)
- MATLAB 2D hist()
- MATLAB 2D barh()
- MATLAB 2D barh()(1)
- MATLAB 2D quiver()
- MATLAB 2D quiver()(1)
- filename = path(file).stem python 是什么(1)
- : 在 matlab (1)
- matlab 轴 - Matlab (1)
- MATLAB中的饼图
- MATLAB中的饼图(1)
- MATLAB 2-D图
- 根 matlab (1)
- MATLAB 2-D图(1)
- filename = path(file).stem python 代码示例是什么
- MATLAB 2D loglog()
- MATLAB 2D errorbar()(1)
- MATLAB 2D Semilogy()
- MATLAB 2D Semilogy()(1)
📜 MATLAB 2D stem()
📅 最后修改于: 2021-01-07 02:42:17 🧑 作者: Mango
MATLAB stem()
二维词干图将数据显示为从基线沿x轴延伸的线。 y位置代表数据值的圆(默认值)或另一个标记终止每个词干。
句法
stem(Y) // It plots the data sequence Y as stems that extends from equally spaced and automatically created values along the x-axis. When Y is a matrix, stem plot, all items in a row against the same x value.
stem(X,Y) // It plot X versus the column of Y. X and Y are vectors or matrices of a similar size. X can be the row or a column vector, and Y is a matrix with length(X) rows.
stem(...,'fill') // It specifies whether to color the circle at the end of the stem.
stem(...,LineSpec) // It specifies the line style, marker symbol, and color.
h = stem(...) // It returns a vector of Stem objects in h.
例
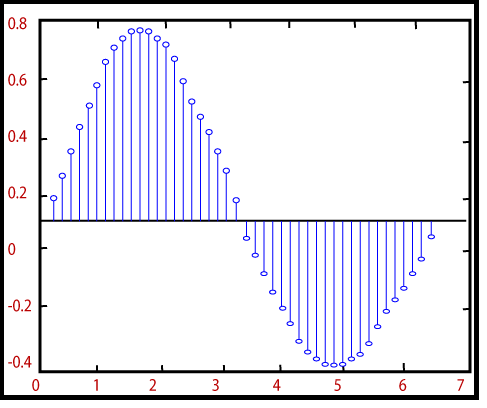
f=e^-t/5 sint,0≤t≤2π
t=linspace (0, 2*pi, 200);
f=exp (-.2*t).*sin(t);
stem(t, f)
输出: