📌 相关文章
- Python中的 Matplotlib.pyplot.loglog()函数(1)
- Python中的 Matplotlib.pyplot.loglog()函数
- MATLAB 2D fill()(1)
- MATLAB 2D fill()
- MATLAB 2D area()
- MATLAB 2D Bar()
- MATLAB 2D Bar()(1)
- c++ 代码 2d 块 - C++ (1)
- MATLAB 2D Pie()
- MATLAB 2D Pie()(1)
- MATLAB 2D hist()(1)
- MATLAB 2D hist()
- MATLAB 2D barh()
- MATLAB 2D barh()(1)
- MATLAB 2D quiver()
- MATLAB 2D quiver()(1)
- MATLAB 2-D图(1)
- MATLAB中的饼图(1)
- matlab 轴 - Matlab (1)
- : 在 matlab (1)
- MATLAB 2-D图
- MATLAB中的饼图
- 根 matlab (1)
- MATLAB 2D stem()
- MATLAB 2D stem()(1)
- MATLAB 2D Semilogy()
- MATLAB 2D errorbar()
- MATLAB 2D errorbar()(1)
- MATLAB 2D Semilogy()(1)
📜 MATLAB 2D loglog()
📅 最后修改于: 2021-01-07 02:33:22 🧑 作者: Mango
MATLAB loglog()
它使用x和y轴的对数刻度生成向量x和y的图。
句法
loglog(Y)// It should plot the columns of Y versus their index if Y includes real numbers. If Y includes complex numbers, loglog(Y) and loglog(real(Y),imag(Y)) are equivalent.
loglog(X1,Y1,...)// It plots all Yn versus Xn pairs.
loglog(X1,Y1,LineSpec,...)// It plots all the lines described by the Xn,Yn,LineSpec triples, where LineSpec determine line type, marker symbol, and color of the plotted lines.
loglog(...,'PropertyName',PropertyValue,...)// It sets line property values for all the charting lines created.
loglog(ax,...)// It generates the line in the axes specified by ax instead of in the current axes (gca). The option ax precedes any of the input argument combinations in the previous syntaxes.
h = loglog(...)// It returns a column vector of chart line objects.
例
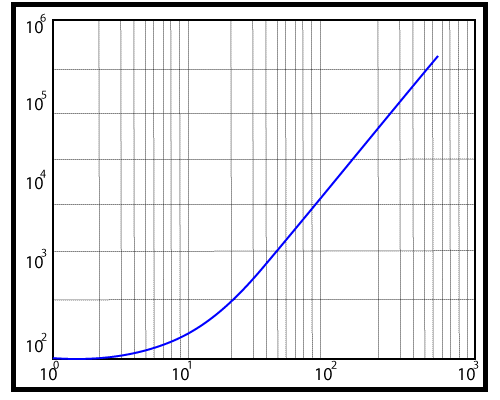
使用对数刻度的x轴和y轴创建图。
x=e^t,y=100+e^2t,0≤t≤2π
t=linspace(0, 2*pi,200);
x=exp(t)
y=100+exp(2*t);
loglog(x, y), grid
输出: