📌 相关文章
- MATLAB 2D fill()(1)
- MATLAB 2D fill()
- MATLAB 2D area()
- MATLAB 2D Bar()(1)
- MATLAB 2D Bar()
- c++ 代码 2d 块 - C++ (1)
- MATLAB 2D Pie()(1)
- MATLAB 2D Pie()
- MATLAB 2D hist()(1)
- MATLAB 2D hist()
- MATLAB 2D barh()(1)
- MATLAB 2D barh()
- MATLAB 2D quiver()
- MATLAB 2D quiver()(1)
- MATLAB 2-D图
- matlab 轴 - Matlab (1)
- 根 matlab (1)
- MATLAB中的饼图
- MATLAB 2-D图(1)
- : 在 matlab (1)
- MATLAB中的饼图(1)
- MATLAB 2D stem()
- MATLAB 2D stem()(1)
- MATLAB 2D loglog()
- MATLAB 2D loglog()(1)
- MATLAB 2D errorbar()(1)
- MATLAB 2D Semilogx()
- MATLAB 2D errorbar()
- MATLAB 2D Semilogx()(1)
📜 MATLAB 2D fplot()
📅 最后修改于: 2021-01-07 02:30:41 🧑 作者: Mango
MATLAB 2-D图
二维绘图有许多特定的图形功能。它们被用作我们刚刚讨论的plot命令的替代方法。 MATLAB帮助中心列出了20多种类型的二维图。示例包括茎图,阶梯图,条形图,饼图和罗盘图。
在这里,我们将讨论MATLAB中的2D绘图函数。
MATLAB fplot()
它用于在特定限制之间进行绘图。该函数的形式必须为y = f(x),其中x是指定极限的向量,y是与x大小相同的向量。
句法
fplot(fun, limits) //    A function fun is plotted in between the limit specified
fplot(fun, limits, linespace) // It allows plotting fun with line specification
fplot(fun, limits, tol) //  It allows plotting with relative error tolerance 'tol'.If not specified default tolerance will be 2e-3 ie .2%  accuracy.
fplot(fun, limits, tol, linespace)//     It allows plotting with relative tolerance and line specification
例
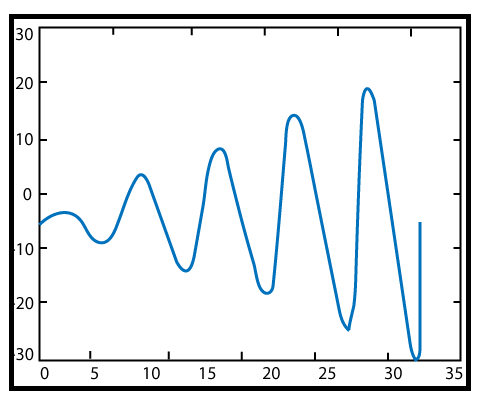
f(t)=t sin t, 0≤t≤10π
fplot ('x.*sin(x)',[0 10*pi])
输出: