使用 Matplotlib 绘制等高线图 - Python
等高线图也称为水平图,是一种用于在 2-D 空间中进行多变量分析和可视化 3-D 图的工具。如果我们将 X 和 Y 作为我们想要绘制的变量,那么响应 Z 将被绘制为 XY 平面上的切片,因为轮廓有时被称为Z 切片或等响应。
等高线图广泛用于可视化山的密度、海拔或高度以及气象部门。由于使用如此广泛, matplotlib.pyplot提供了一种方法contour使我们可以轻松绘制等高线图。
matplotlib.pyplot.contour
matplotlib.pyplot.contour()通常在Z = f(X, Y)时很有用,即 Z 作为输入 X 和 Y 的函数而变化contourf()也可用,它允许我们绘制填充轮廓。
Syntax: matplotlib.pyplot.contour([X, Y, ] Z, [levels], **kwargs)
Parameters:
X, Y: 2-D numpy arrays with same shape as Z or 1-D arrays such that len(X)==M and len(Y)==N (where M and N are rows and columns of Z)
Z: The height values over which the contour is drawn. Shape is (M, N)
levels: Determines the number and positions of the contour lines / regions.
Returns: QuadContourSet
下面的示例说明了 matplotlib.pyplot 中的matplotlib.pyplot.contour()函数:
示例 #1:使用仅绘制等高线的contour()绘制等高线。
# Implementation of matplotlib function
import matplotlib.pyplot as plt
import numpy as np

feature_x = np.arange(0, 50, 2)
feature_y = np.arange(0, 50, 3)

# Creating 2-D grid of features
[X, Y] = np.meshgrid(feature_x, feature_y)

fig, ax = plt.subplots(1, 1)

Z = np.cos(X / 2) + np.sin(Y / 4)

# plots contour lines
ax.contour(X, Y, Z)

ax.set_title('Contour Plot')
ax.set_xlabel('feature_x')
ax.set_ylabel('feature_y')

plt.show()
输出: 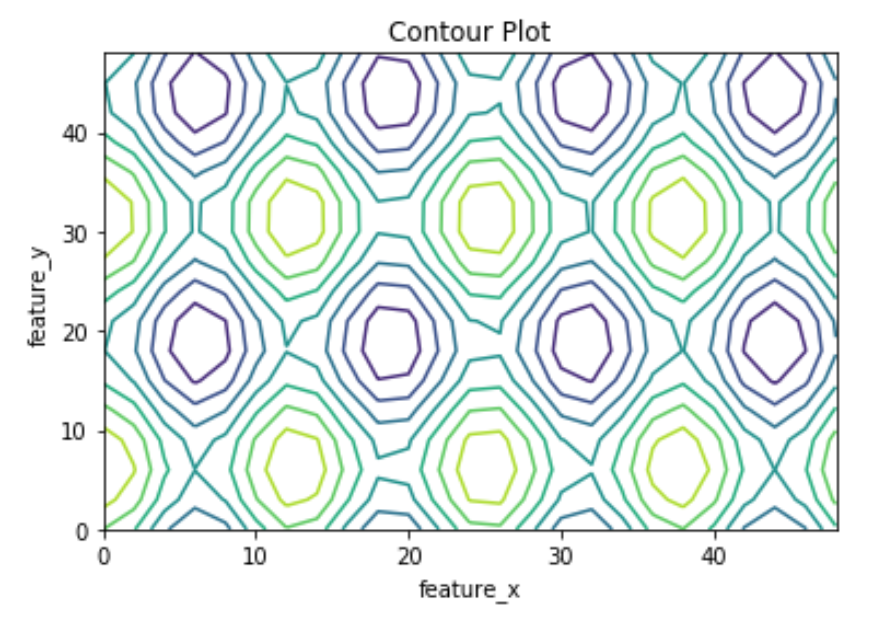
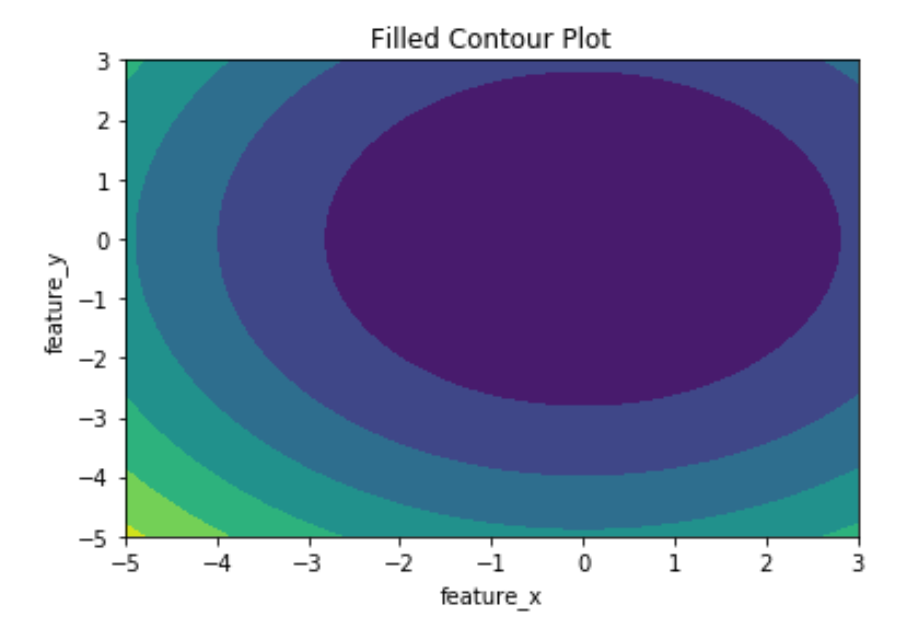
示例#2:使用contourf()绘制等高线,它绘制填充的等高线。
# Implementation of matplotlib function
import matplotlib.pyplot as plt
import numpy as np

feature_x = np.linspace(-5.0, 3.0, 70)
feature_y = np.linspace(-5.0, 3.0, 70)

# Creating 2-D grid of features
[X, Y] = np.meshgrid(feature_x, feature_y)

fig, ax = plt.subplots(1, 1)

Z = X ** 2 + Y ** 2

# plots filled contour plot
ax.contourf(X, Y, Z)

ax.set_title('Filled Contour Plot')
ax.set_xlabel('feature_x')
ax.set_ylabel('feature_y')

plt.show()
输出: