更改 R 中 ggplot2 条形图中条形图的空间和宽度
在本文中,我们将看到如何在 R 中更改 ggplot2 barplot 中条的空间和宽度。
对于使用 ggplot2 创建一个简单的条形图,首先我们必须使用library()函数加载ggplot2包。如果您尚未安装,则可以通过在 R 控制台中编写以下命令来安装它。
install.packages("ggplot2")然后我们创建一个 DataFrame 用于绘图。在 DataFrame 中,我们使用两个向量Month & Revenue 。将此数据框命名为DF 。然后我们使用ggplot()函数将此 DataFrame 和向量分配给绘图。我们将月份向量设置为 X 轴,将收入设置为 Y 轴。然后,我们让这个情节Barplot加入geom_bar()函数来ggplot()函数。在 geom_bar()函数,我们将stat参数设置为身份模式。默认 geom_bar 使用 stat=”bin”。这使得每个条形的高度等于每个组中的案例数。如果我们希望条形的高度代表数据中的值,我们必须使用 stat=”identity” 将值映射到 Y 美学。这里不需要使用填充和颜色参数来创建 BarPlot。
R
# Load Package
library("ggplot2")

# Create a DataFrame
DF <- data.frame(Month = c("Mar", "Apr", "May", "Jun", "Jul"),
                   Revenue = c(2, 9, 3, 11, 7))

# Create a Simple BarPlot using ggplot2
ggplot(DF, aes(Month, Revenue)) +
  geom_bar(stat = "identity", fill = "green", color = "black")
R
# Load Package
library("ggplot2")

# Create DataFrame
DF <- data.frame(Month = c("Mar", "Apr", "May", "Jun", "Jul"),
                   Revenue = c(2, 9, 3, 11, 7))

# Create a BarPlot with increased width
# of Bars and decreased Space between Bars
ggplot(DF, aes(Month, Revenue))+
  geom_bar(stat = "identity", fill = "green",
           color = "black", width = 0.98)
R
# Load Package
library("ggplot2")

# Create DataFrame
DF <- data.frame(Month = c("Mar", "Apr", "May", "Jun", "Jul"),
                   Revenue = c(2, 9, 3, 11, 7))

# Create a BarPlot with decreased width of
# Bars and increased Space between Bars
ggplot(DF, aes(Month, Revenue))+
  geom_bar(stat = "identity", fill = "green",
           color = "black", width = 0.40)
输出:
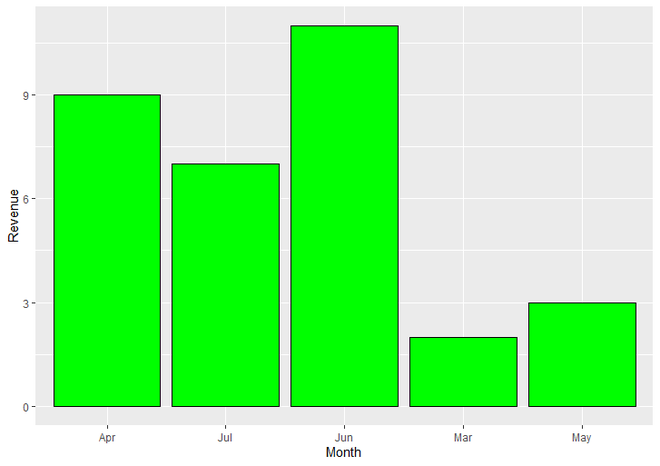
在 R 中使用 ggplot2 的 BarPlot
要增加或减少 BarPlot 条形图的宽度,我们只需为 geom_bar()函数再分配一个宽度参数。我们可以根据我们的要求给出从 0.00 到 1.00 的值。将有两个方面,要么我们想增加条的宽度并减少条之间的空间,要么我们想减少条的宽度并增加条之间的空间。
Syntax : geom_bar(stat, fill, color, width)
Parameters :
- stat : Here we have set stat parameter to identity mode. Which is used when we want to the heights of bars to represent values in the data (Y aesthetic).
- fill : Represents Color of bars.
- color : Represents Color of border of the bars.
- width : Represents Width of the bars.
Return : ggplot2 BarPlot.
示例 1:增加条形之间的宽度并减少其间距
当我们想要增加条形的宽度和减少条形之间的空间时,我们只需使用 geom_bar()函数的宽度参数即可。这里我们将宽度参数的值设置为 0.98。您可以根据需要在 0.00 到 1.00 之间选择“宽度”参数的值。当条形宽度增加时,条形之间的空间会自动减小。所有其他的东西都在那里。
geom_bar(stat = “identity”, fill = “green”, color = “black”, width = 0.98)
代码:
电阻
# Load Package
library("ggplot2")

# Create DataFrame
DF <- data.frame(Month = c("Mar", "Apr", "May", "Jun", "Jul"),
                   Revenue = c(2, 9, 3, 11, 7))

# Create a BarPlot with increased width
# of Bars and decreased Space between Bars
ggplot(DF, aes(Month, Revenue))+
  geom_bar(stat = "identity", fill = "green",
           color = "black", width = 0.98)
输出:

BarPlot 增加条的宽度和减少条之间的空间
示例 2:减小条形之间的宽度并增加其间距。
当我们想要减小条形的宽度并增加条形之间的空间时,我们只需使用 geom_bar()函数的宽度参数即可。这里我们将宽度参数的值设置为 0.40。您可以根据需要在 0.00 到 1.00 之间选择“宽度”参数的值。当条的宽度减小时,条之间的空间会自动增加。所有其他的东西都在那里。
geom_bar(stat = “identity”, fill = “green”, color = “black”, width = 0.40)
代码:
电阻
# Load Package
library("ggplot2")

# Create DataFrame
DF <- data.frame(Month = c("Mar", "Apr", "May", "Jun", "Jul"),
                   Revenue = c(2, 9, 3, 11, 7))

# Create a BarPlot with decreased width of
# Bars and increased Space between Bars
ggplot(DF, aes(Month, Revenue))+
  geom_bar(stat = "identity", fill = "green",
           color = "black", width = 0.40)
输出:

BarPlot 减少条的宽度和增加条之间的空间