Python中的逆伽马分布
逆 Gamma 分布是在正实线上有两个参数的连续概率分布。它是根据伽马分布分布的变量的倒数分布。它在贝叶斯统计中作为正态分布的未知方差的边际分布非常有用。它用于根据精度考虑正态分布的替代参数,该精度实际上是方差的倒数。

scipy.stats.invgamma() :
它是一个倒置伽马连续随机变量。它是rv_continuous类的一个实例。它继承自泛型方法的集合,并将它们与完整的分发规范相结合。代码 #1:创建反伽玛连续随机变量
from scipy.stats import invgamma

numargs = invgamma.numargs
[a] = [0.3] * numargs
rv = invgamma (a)

print ("RV : \n", rv)
输出 :
RV :
scipy.stats._distn_infrastructure.rv_frozen object at 0x00000230B0B28748
代码 #2:逆 Gamma 连续变量和概率分布
import numpy as np
quantile = np.arange (0.01, 1, 0.1)

# Random Variates
R = invgamma.rvs(a, scale = 2,  size = 10)
print ("Random Variates : \n", R)

# PDF
R = invgamma .pdf(a, quantile, loc = 0, scale = 1)
print ("\nProbability Distribution : \n", R)
输出 :
Random Variates :
 [4.18816252e+00 2.02807957e+03 8.37914946e+01 1.94368997e+00
 3.78345091e+00 1.00496176e+06 3.42396458e+03 3.45520522e+00
 2.81037118e+00 1.72359706e+03]

Probability Distribution :
 [0.0012104  0.0157619  0.03512042 0.05975504 0.09007126 0.12639944
 0.16898506 0.21798098 0.27344182 0.33532072]
代码#3:图形表示。
import numpy as np
import matplotlib.pyplot as plt

distribution = np.linspace(0, np.minimum(rv.dist.b, 3))
print("Distribution : \n", distribution)

plot = plt.plot(distribution, rv.pdf(distribution))
输出 :
Distribution :
 [0.         0.06122449 0.12244898 0.18367347 0.24489796 0.30612245
 0.36734694 0.42857143 0.48979592 0.55102041 0.6122449  0.67346939
 0.73469388 0.79591837 0.85714286 0.91836735 0.97959184 1.04081633
 1.10204082 1.16326531 1.2244898  1.28571429 1.34693878 1.40816327
 1.46938776 1.53061224 1.59183673 1.65306122 1.71428571 1.7755102
 1.83673469 1.89795918 1.95918367 2.02040816 2.08163265 2.14285714
 2.20408163 2.26530612 2.32653061 2.3877551  2.44897959 2.51020408
 2.57142857 2.63265306 2.69387755 2.75510204 2.81632653 2.87755102
 2.93877551 3.        ]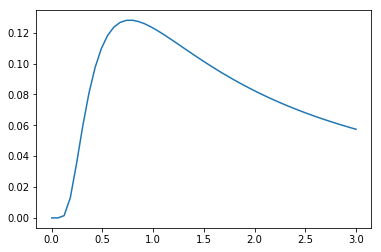
代码#4:改变位置参数
import matplotlib.pyplot as plt
import numpy as np

x = np.linspace(0, 5, 100)

# Varying positional arguments
y1 = invgamma .pdf(x, 1, 3)
y2 = invgamma .pdf(x, 1, 4)
plt.plot(x, y1, "*", x, y2, "r--")
输出 : 