在Python中使用 Seaborn 的 Stripplot
Seaborn是一个了不起的可视化库,用于在Python中绘制统计图形。它提供了漂亮的默认样式和调色板,使统计图更具吸引力。它建立在 matplotlib 库之上,并紧密集成到 Pandas 的数据结构中。
带状图
条形图是单独绘制的。在显示所有观察结果以及底层分布的一些表示的情况下,它是对箱线图或小提琴图的一个很好的补充。它用于根据类别绘制散点图。
Syntax: seaborn.stripplot(*, x=None, y=None, hue=None, data=None, order=None, hue_order=None, jitter=True, dodge=False, orient=None, color=None, palette=None, size=5, edgecolor=’gray’, linewidth=0, ax=None, **kwargs)
Parameters:
- x, y, hue: Inputs for plotting long-form data.
- data: Dataset for plotting.
- order: It is the order to plot the categorical levels in.
- color: It is the color for all of the elements, or seed for a gradient palette
Returns: This method returns the Axes object with the plot drawn onto it.
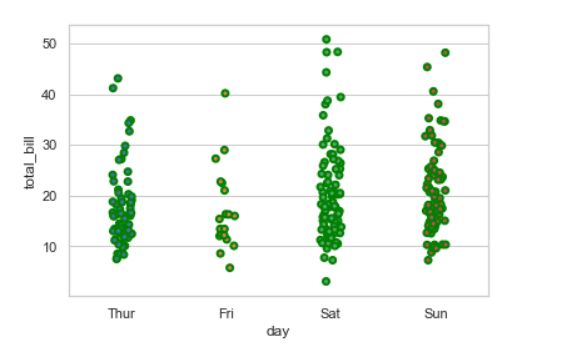
示例:使用 stripplot() 对“tips”数据集进行基本可视化
Python3
import seaborn
import matplotlib.pyplot as plt

seaborn.set(style = 'whitegrid')
tip = seaborn.load_dataset("tips")

seaborn.stripplot(x="day", y="total_bill", data=tip)

plt.show()
Python3
# Python program to illustrate
# Stripplot using inbuilt data-set
# given in seaborn

# importing the required module
import seaborn
import matplotlib.pyplot as plt

# use to set style of background of plot
seaborn.set(style = 'whitegrid')

# loading data-set
tips = seaborn.load_dataset("tips")
seaborn.stripplot(x=tips["total_bill"])
Python3
# Python program to illustrate
# Stripplot using inbuilt data-set
# given in seaborn

# importing the required module
import seaborn
import matplotlib.pyplot as plt

# use to set style of background of plot
seaborn.set(style = 'whitegrid')

# loading data-set
tips = seaborn.load_dataset("tips")

seaborn.stripplot(x="day", y="total_bill", data=tips, jitter=0.1)
Python3
# Python program to illustrate
# Stripplot using inbuilt data-set
# given in seaborn

# importing the required module
import seaborn
import matplotlib.pyplot as plt

# use to set style of background of plot
seaborn.set(style = 'whitegrid')

# loading data-set
tips = seaborn.load_dataset("tips")

seaborn.stripplot(y="total_bill", x="day", data=tips,
                   linewidth=3)
Python3
seaborn.stripplot(y="total_bill", x="day", data=tips,
                   linewidth=2,edgecolor='green')
Python3
# Python program to illustrate
# Stripplot using inbuilt data-set
# given in seaborn

# importing the required module
import seaborn
import matplotlib.pyplot as plt

# use to set style of background of plot
seaborn.set(style = 'whitegrid')

# loading data-set
tips = seaborn.load_dataset("tips")

seaborn.stripplot(x="sex", y="total_bill", hue="day", data=tips)
Python3
seaborn.stripplot(x="day", y="total_bill", hue="smoker",
                   data=tips, palette="Set2", dodge=True)
Python3
import seaborn
import matplotlib.pyplot as plt

seaborn.set(style = 'whitegrid')

tips = seaborn.load_dataset("tips")

seaborn.stripplot(x="day", y="total_bill", hue="smoker",
                  data=tips, palette="Set1", size=20,
                  marker="s", alpha=0.2)

plt.show()
输出:

使用 Stripplot 绘制单个水平条形图
如果我们只使用一个数据变量而不是两个数据变量,那么这意味着轴将这些数据变量中的每一个都表示为一个轴。
X 表示 x 轴,y 表示 y 轴。
句法:
seaborn.stripplot(x)代码:
蟒蛇3
# Python program to illustrate
# Stripplot using inbuilt data-set
# given in seaborn

# importing the required module
import seaborn
import matplotlib.pyplot as plt

# use to set style of background of plot
seaborn.set(style = 'whitegrid')

# loading data-set
tips = seaborn.load_dataset("tips")
seaborn.stripplot(x=tips["total_bill"])
输出:

使用抖动参数绘制带状图
抖动可用于提供沿水平轴的位移,这在存在大量数据点时很有用。您可以指定抖动量(均匀随机变量支持宽度的一半),或者仅使用 True 作为良好的默认值。
句法:
seaborn.stripplot(x, y, data, jitter)
代码:
蟒蛇3
# Python program to illustrate
# Stripplot using inbuilt data-set
# given in seaborn

# importing the required module
import seaborn
import matplotlib.pyplot as plt

# use to set style of background of plot
seaborn.set(style = 'whitegrid')

# loading data-set
tips = seaborn.load_dataset("tips")

seaborn.stripplot(x="day", y="total_bill", data=tips, jitter=0.1)
输出:

使用线宽在数据点周围绘制轮廓
构成绘图元素的灰线的宽度。每当我们增加线宽比点也将自动增加。
句法:
seaborn.stripplot(x, y, data, linewidth)
蟒蛇3
# Python program to illustrate
# Stripplot using inbuilt data-set
# given in seaborn

# importing the required module
import seaborn
import matplotlib.pyplot as plt

# use to set style of background of plot
seaborn.set(style = 'whitegrid')

# loading data-set
tips = seaborn.load_dataset("tips")

seaborn.stripplot(y="total_bill", x="day", data=tips,
                   linewidth=3)
输出:

我们可以用edgecolor改变颜色
蟒蛇3
seaborn.stripplot(y="total_bill", x="day", data=tips,
                   linewidth=2,edgecolor='green')
输出:
使用色调参数绘制带状图
虽然点是在二维中绘制的,但可以通过根据第三个变量为点着色来将另一个维度添加到图中。
句法:
sns.stripplot(x, y, hue, data);
蟒蛇3
# Python program to illustrate
# Stripplot using inbuilt data-set
# given in seaborn

# importing the required module
import seaborn
import matplotlib.pyplot as plt

# use to set style of background of plot
seaborn.set(style = 'whitegrid')

# loading data-set
tips = seaborn.load_dataset("tips")

seaborn.stripplot(x="sex", y="total_bill", hue="day", data=tips)
输出:

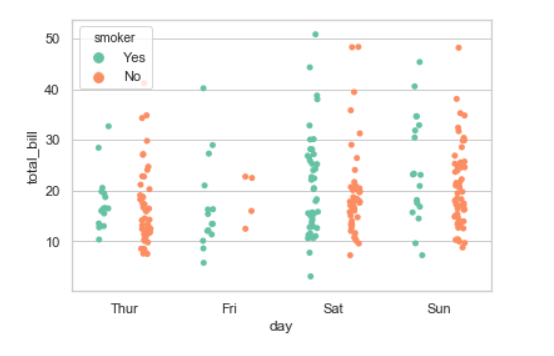
在主要分类轴上的不同位置绘制色调变量的每个级别
使用色调嵌套时,将 dodge 设置为 True 将沿分类轴分离不同色调级别的条带。 Palette 用于色调变量的不同级别。
句法:
seaborn.stripplot(x, y, data, hue, palette, dodge)
蟒蛇3
seaborn.stripplot(x="day", y="total_bill", hue="smoker",
                   data=tips, palette="Set2", dodge=True)
输出:
Possible values of palette are :
Accent, Accent_r, Blues, Blues_r, BrBG, BrBG_r, BuGn, BuGn_r, BuPu, BuPu_r,
CMRmap, CMRmap_r, Dark2, Dark2_r, GnBu, GnBu_r, Greens, Greens_r, Greys, Greys_r,
OrRd, OrRd_r, Oranges, Oranges_r, PRGn, PRGn_r, Paired, Paired_r, Pastel1, Pastel1_r, Pastel2,
Pastel2_r, PiYG, PiYG_r, PuBu, PuBuGn, PuBuGn_r, PuBu_r, PuOr, PuOr_r, PuRd, PuRd_r, Purples,
Purples_r, RdBu, RdBu_r, RdGy, RdGy_r, RdPu, RdPu_r, RdYlBu, RdYlBu_r, RdYlGn, RdYlGn_r, Reds,
Reds_r, Set1, Set1_r, Set2, Set2_r, Set3, Set3_r, Spectral, Spectral_r, Wistia, Wistia_r, YlGn,
YlGnBu, YlGnBu_r, YlGn_r, YlOrBr, YlOrBr_r, YlOrRd, YlOrRd_r, afmhot, afmhot_r, autumn, autumn_r,
binary, binary_r, bone, bone_r, brg, brg_r, bwr, bwr_r, cividis, cividis_r, cool, cool_r, coolwarm,
coolwarm_r, copper, copper_r, cubehelix, cubehelix_r, flag, flag_r, gist_earth, gist_earth_r,
gist_gray, gist_gray_r, gist_heat, gist_heat_r, gist_ncar, gist_ncar_r, gist_rainbow, gist_rainbow_r,
gist_stern, gist_stern_r, gist_yarg, gist_yarg_r, gnuplot, gnuplot2, gnuplot2_r, gnuplot_r,
gray, gray_r, hot, hot_r, hsv, hsv_r, icefire, icefire_r, inferno, inferno_r, jet, jet_r, magma,
使用标记和 alpha 参数绘制大点和不同的美学
我们将使用 alpha 来管理数据点的透明度,并使用标记为标记来自定义数据点。
蟒蛇3
import seaborn
import matplotlib.pyplot as plt

seaborn.set(style = 'whitegrid')

tips = seaborn.load_dataset("tips")

seaborn.stripplot(x="day", y="total_bill", hue="smoker",
                  data=tips, palette="Set1", size=20,
                  marker="s", alpha=0.2)

plt.show()
输出:
