使用 OpenCV 在Python中进行线检测霍夫线法
霍夫变换是一种在图像处理中用于检测任何形状的方法,如果该形状可以用数学形式表示的话。即使形状有点破损或变形,它也可以检测到。
我们将看到 Hough 变换如何使用 HoughLine 变换方法进行线检测。要应用 Houghline 方法,首先需要对特定图像进行边缘检测。对于边缘检测技术,请阅读文章边缘检测
Houghline 方法的基础知识
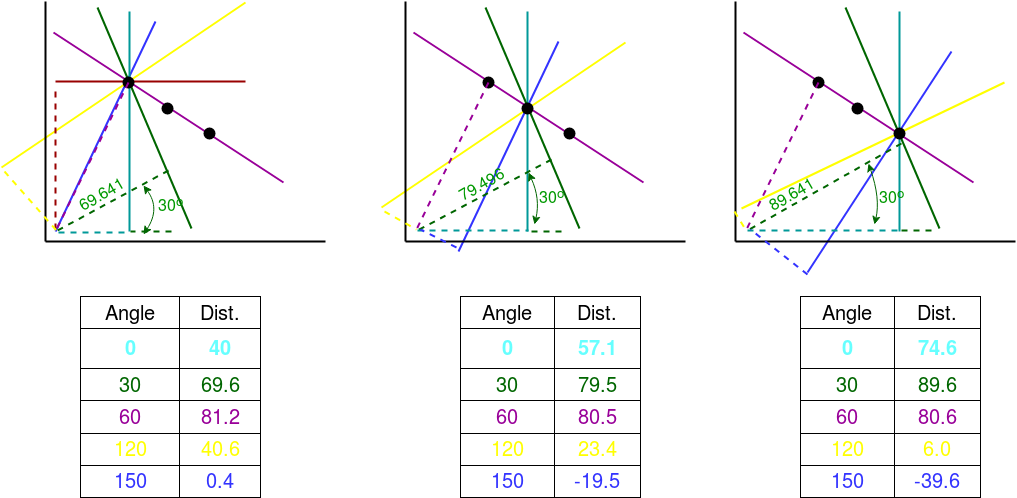
一条线可以表示为 y = mx + c 或参数形式,如 r = xcosθ + ysinθ 其中 r 是从原点到直线的垂直距离,θ 是该垂直线与水平轴形成的角度,在计数器中测量- 顺时针(该方向因您表示坐标系的方式而异。此表示在 OpenCV 中使用)。

所以任何一条线都可以用这两个术语表示,(r, θ)。
Houghline方法的工作:
- 首先,它创建一个二维数组或累加器(保存两个参数的值),最初设置为零。
- 让行表示 r,列表示 (θ)theta。
- 数组的大小取决于您需要的精度。假设您希望角度的精度为 1 度,则需要 180 列(直线的最大度数为 180)。
- 对于 r,可能的最大距离是图像的对角线长度。所以取一个像素精度,行数可以是图像的对角线长度。
例子:
考虑一个 100×100 的图像,中间有一条水平线。取线的第一个点。你知道它的 (x,y) 值。现在在直线方程中,输入值 θ(theta) = 0,1,2,….,180 并检查你得到的 r。对于每个 (r, 0) 对,您在累加器中相应的 (r,0) 单元格中将值加一。所以现在在累加器中,单元格 (50,90) = 1 以及其他一些单元格。
现在取线上的第二个点。执行与上述相同的操作。增加与您获得的 (r,0) 对应的单元格中的值。这一次,单元格 (50,90) = 2。我们实际上是在对 (r,0) 值进行投票。您对线上的每个点继续此过程。在每一点,单元格 (50,90) 将被增加或投票,而其他单元格可能会或可能不会被投票。这样,最后,单元格 (50,90) 将获得最大票数。因此,如果您在累加器中搜索最大票数,您会得到值 (50,90),它表示该图像中有一条线距原点 50 度且角度为 90 度。
上面解释的所有内容都封装在 OpenCV函数cv2.HoughLines() 中。它只是返回一个 (r, 0) 值的数组。 r 以像素为单位,0 以弧度为单位。
Python
# Python program to illustrate HoughLine
# method for line detection
import cv2
import numpy as np

# Reading the required image in
# which operations are to be done.
# Make sure that the image is in the same
# directory in which this python program is
img = cv2.imread('image.jpg')

# Convert the img to grayscale
gray = cv2.cvtColor(img,cv2.COLOR_BGR2GRAY)

# Apply edge detection method on the image
edges = cv2.Canny(gray,50,150,apertureSize = 3)

# This returns an array of r and theta values
lines = cv2.HoughLines(edges,1,np.pi/180, 200)

# The below for loop runs till r and theta values
# are in the range of the 2d array
for r_theta in lines[0]:
    r,theta = r_theta[0]
    # Stores the value of cos(theta) in a
    a = np.cos(theta)

    # Stores the value of sin(theta) in b
    b = np.sin(theta)

    # x0 stores the value rcos(theta)
    x0 = a*r

    # y0 stores the value rsin(theta)
    y0 = b*r

    # x1 stores the rounded off value of (rcos(theta)-1000sin(theta))
    x1 = int(x0 + 1000*(-b))

    # y1 stores the rounded off value of (rsin(theta)+1000cos(theta))
    y1 = int(y0 + 1000*(a))

    # x2 stores the rounded off value of (rcos(theta)+1000sin(theta))
    x2 = int(x0 - 1000*(-b))

    # y2 stores the rounded off value of (rsin(theta)-1000cos(theta))
    y2 = int(y0 - 1000*(a))

    # cv2.line draws a line in img from the point(x1,y1) to (x2,y2).
    # (0,0,255) denotes the colour of the line to be
    #drawn. In this case, it is red.
    cv2.line(img,(x1,y1), (x2,y2), (0,0,255),2)

# All the changes made in the input image are finally
# written on a new image houghlines.jpg
cv2.imwrite('linesDetected.jpg', img)
Python3
import cv2
import numpy as np

# Read image
image = cv2.imread('path/to/image.png')

# Convert image to grayscale
gray = cv2.cvtColor(image,cv2.COLOR_BGR2GRAY)

# Use canny edge detection
edges = cv2.Canny(gray,50,150,apertureSize=3)

# Apply HoughLinesP method to
# to directly obtain line end points
lines = cv2.HoughLinesP(
            edges, # Input edge image
            1, # Distance resolution in pixels
            np.pi/180, # Angle resolution in radians
            threshold=100, # Min number of votes for valid line
            minLineLength=5, # Min allowed length of line
            maxLineGap=10 # Max allowed gap between line for joining them
            )

# Iterate over points
for points in lines:
      # Extracted points nested in the list
    x1,y1,x2,y2=points[0]
    # Draw the lines joing the points
    # On the original image
    cv2.line(image,(x1,y1),(x2,y2),(0,255,0),2)
    # Maintain a simples lookup list for points
    lines_list.append([(x1,y1),(x2,y2)])

# Save the result image
cv2.imwrite('detectedLines.png',image)
函数详述(cv2.HoughLines (edges,1,np.pi/180, 200)):
- 第一个参数,输入图像应该是二值图像,因此在找到应用霍夫变换之前应用阈值边缘检测。
- 第二和第三个参数分别是 r 和 θ(theta) 精度。
- 第四个参数是阈值,这意味着它应该获得的最低投票数才能被视为一条线。
- 请记住,票数取决于线上的点数。所以它代表了应该被检测到的线的最小长度。
直接提取点的另一种更简单的方法:
Python3
import cv2
import numpy as np

# Read image
image = cv2.imread('path/to/image.png')

# Convert image to grayscale
gray = cv2.cvtColor(image,cv2.COLOR_BGR2GRAY)

# Use canny edge detection
edges = cv2.Canny(gray,50,150,apertureSize=3)

# Apply HoughLinesP method to
# to directly obtain line end points
lines = cv2.HoughLinesP(
            edges, # Input edge image
            1, # Distance resolution in pixels
            np.pi/180, # Angle resolution in radians
            threshold=100, # Min number of votes for valid line
            minLineLength=5, # Min allowed length of line
            maxLineGap=10 # Max allowed gap between line for joining them
            )

# Iterate over points
for points in lines:
      # Extracted points nested in the list
    x1,y1,x2,y2=points[0]
    # Draw the lines joing the points
    # On the original image
    cv2.line(image,(x1,y1),(x2,y2),(0,255,0),2)
    # Maintain a simples lookup list for points
    lines_list.append([(x1,y1),(x2,y2)])

# Save the result image
cv2.imwrite('detectedLines.png',image)
总结过程
- 在图像分析上下文中,图像中边缘段(即 X,Y )的点的坐标是已知的,因此在参数线方程中用作常数,而 R(rho) 和 Theta(θ) 是我们寻求的未知变量。
- 如果我们绘制由每个 (theta) 定义的可能 (r) 值,则笛卡尔图像空间中的点映射到极坐标 Hough 参数空间中的曲线(即正弦曲线)。这种点到曲线的变换是直线的霍夫变换。
- 该变换是通过将霍夫参数空间量化为有限区间或累加器单元来实现的。随着算法的运行,每个 (X,Y) 都被转换为离散的 (r,0) 曲线,并且位于该曲线上的累加器(2D 数组)单元递增。
- 累加器阵列中产生的峰值代表了图像中存在相应直线的有力证据。
霍夫变换的应用:
- 它用于隔离图像中特定形状的特征。
- 容忍特征边界描述中的间隙,并且相对不受图像噪声的影响。
- 广泛用于条码扫描、验证和识别