使用Python和 Matplotlib 在图形上绘制各种声音
在本文中,我们将探索使用Python和 Matplotlib 可视化声波的方法。
需要的模块
1. Matplotlib :使用以下命令安装 Matplotlib:
pip install matplotlib2. Numpy : Numpy 会自动安装到 Matplotlib 中。虽然,如果您遇到任何导入错误,请使用以下命令安装 Numpy
pip install numpy注意:如果你和我一样在 Linux 上,那么你可能需要使用pip3而不是pip或者你可以创建一个虚拟环境并运行上面的命令。
方法
- 导入 matplotlib、Numpy、wave 和 sys 模块。
- 使用wave.open()方法打开音频文件。
- 使用readframes ()函数读取打开的声波的所有帧。
- 使用getframrate ()函数将帧速率存储在变量中。
- 最后,使用帧速率以秒为单位绘制 x 轴。
- 使用 matplotlib.figure()函数绘制派生图
- 根据要求使用标签。
下面是实现。
Python3
# imports
import matplotlib.pyplot as plt
import numpy as np
import wave, sys
# shows the sound waves
def visualize(path: str):
# reading the audio file
raw = wave.open(path)
# reads all the frames
# -1 indicates all or max frames
signal = raw.readframes(-1)
signal = np.frombuffer(signal, dtype ="int16")
# gets the frame rate
f_rate = raw.getframerate()
# to Plot the x-axis in seconds
# you need get the frame rate
# and divide by size of your signal
# to create a Time Vector
# spaced linearly with the size
# of the audio file
time = np.linspace(
0, # start
len(signal) / f_rate,
num = len(signal)
)
# using matplotlib to plot
# creates a new figure
plt.figure(1)
# title of the plot
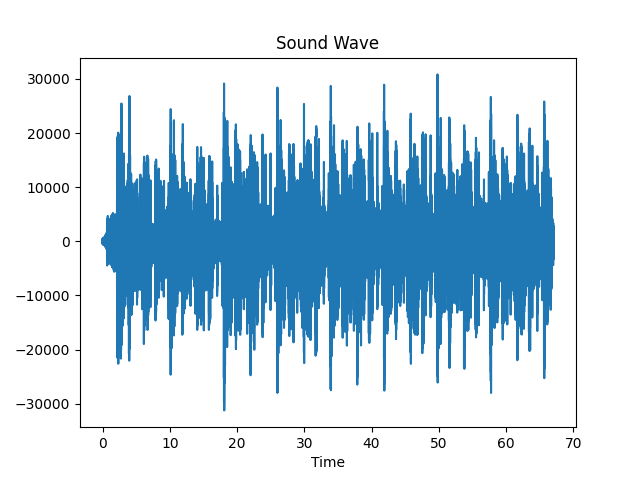
plt.title("Sound Wave")
# label of x-axis
plt.xlabel("Time")
# actual plotting
plt.plot(time, signal)
# shows the plot
# in new window
plt.show()
# you can also save
# the plot using
# plt.savefig('filename')
if __name__ == "__main__":
# gets the command line Value
path = sys.argv[1]
visualize(path)输出:
所以,我们完成了编码,现在是关键时刻。让我们检查一下它是否真的有效。您可以尝试任何音频文件,但要确保它必须是wav文件。如果您有其他文件类型,则可以使用ffmpeg将其转换为 wav 文件。如果您愿意,请随时下载我们将使用的音频文件。您可以使用此链接下载它,但也请尝试其他文件。
要运行代码,您需要在命令行中传递音频文件的路径。为此,请在终端中键入以下内容:
python soundwave.py sample_audio.wav重要的是要注意Python文件的名称是soundwave.py ,音频文件的名称是sample_audio.wav 。您需要根据您的系统更改这些。现在,应该会弹出一个新窗口,并且应该可以看到声波图。如果你使用了我的音频,那么你的情节应该是这样的。