从 R 中的直方图中提取频率计数
直方图基本上用于表示以某些组的形式提供的数据。它是一种精确的图形表示数值数据分布的方法。它是一种条形图,其中 X 轴表示 bin 范围,而 Y 轴提供有关频率的信息。
我们可以使用 R 编程语言中的hist()函数提取直方图的频率计数。 hist()函数用于从给定数据中绘制直方图。
Syntax: hist(v, main, xlab, xlim, ylim, breaks, col, border)
Parameters:
- v: This parameter contains numerical values used in histogram.
- main: This parameter main is the title of the chart.
- col: This parameter is used to set color of the bars.
- xlab: This parameter is the label for horizontal axis.
- border: This parameter is used to set border color of each bar.
- xlim: This parameter is used for plotting values of x-axis.
- ylim: This parameter is used for plotting values of y-axis.
- breaks: This parameter is used as width of each bar.
让我们首先绘制一个直方图,以便可以详细了解值。直方图需要处理某些数据,首先应该创建这些数据,然后将数据和所需参数一起传递给 hist() 方法。
例子:
R
# set seeding value
set.seed(56438)

# create sample data
x <- rnorm(200)

# Extract histogram information
hist_vec <- hist(x)
R
# set seeding value
set.seed(56438)

# create sample data
x <- rnorm(200)

# Extract histogram information
hist_vec <- hist(x)

# Store histogram counts in frequency
frequency <- hist_vec$counts

# Print the frequency
frequency
输出:
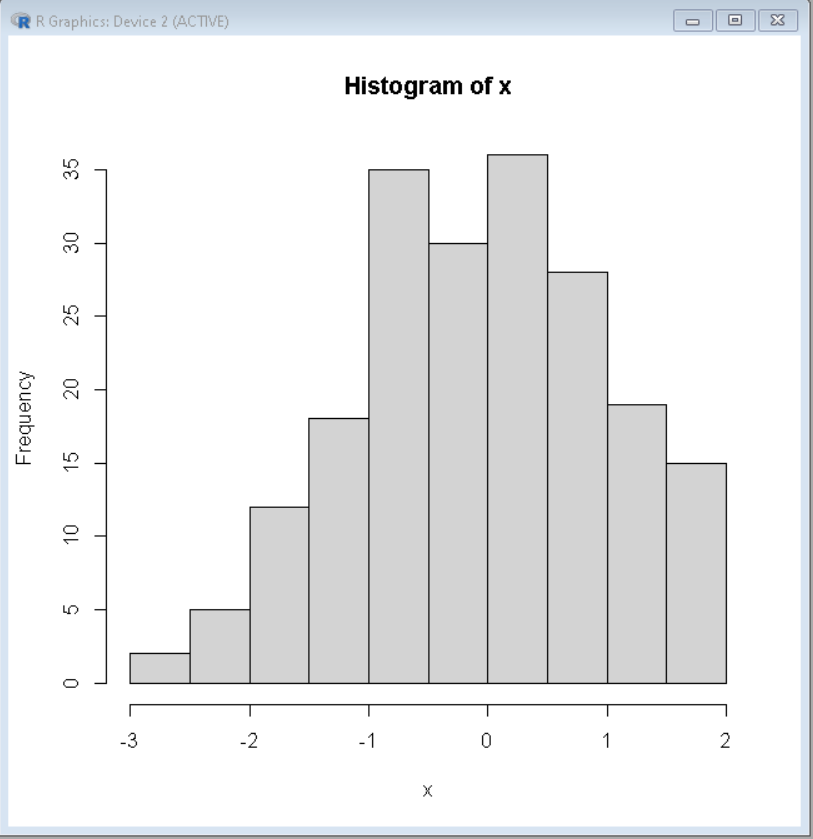
直方图
现在要从该直方图中提取每个元素的出现次数或每个元素的计数或频率,将使用 hist()函数的计数属性。直方图应该保存到一个变量中,稍后应该使用美元符号($)从该变量中提取计数。
句法:
histogram$count
这将生成一个包含每个元素频率的向量。
例子:
电阻
# set seeding value
set.seed(56438)

# create sample data
x <- rnorm(200)

# Extract histogram information
hist_vec <- hist(x)

# Store histogram counts in frequency
frequency <- hist_vec$counts

# Print the frequency
frequency
输出:
[1] 2 5 12 18 35 30 36 28 19 15