Julia 中的探索性数据分析
探索性数据分析(EDA) 用于从数据的主要特征、各种变量的重要性以及变量间的关系方面更好地理解数据。第一步是探索数据集。
在 Julia 中探索给定数据集的方法:
- 使用数据表和应用统计
- 在数据上使用可视化绘图技术
使用数据表和应用统计
第 1 步:安装 DataFrames 包
为了在 Julia 中使用数据表,使用了一种名为 Dataframe 的数据结构。 DataFrame 可以在不影响速度和可扩展性的情况下处理多个操作。
可以使用以下命令安装 Dataframes 包:
using Pkg
Pkg.add(“DataFrames”)
第 2 步:下载数据集
对于数据分析,我们使用了 Iris 数据集。它很容易在线获得。
第 3 步:导入必要的包和数据集
我们先导入我们的DataFrames Package,CSV Package,并加载数据集的Iris.csv文件:
Julia
# Using the DataFrames Package
using DataFrames

# Using the CSV package
using CSV

# Reading the CSV file
Iris = CSV.read(“Iris.csv”)
Julia
# Using the DataFrames Package
using DataFrames

# Using the CSV package
using CSV

# Reading the CSV file
Iris = CSV.read(“Iris.csv”);

# Shape of Dataset
size(Iris)

# List of columns
names(Iris)

# First 10 rows
head(Iris, 10)
Julia
# Using the DataFrames Package
using DataFrames

# Using the CSV package
using CSV

# Reading the CSV file
Iris = CSV.read(“Iris.csv”);

# Access particular column of dataset
Iris[: SepalLength]
Julia
# Using the DataFrames Package
using DataFrames

# Using the CSV package
using CSV

# Reading the CSV file
Iris = CSV.read(“Iris.csv”);

# Using describe function
# to get statistics of a dataset
describe(Iris)

# Using describe function to get
# statistics of a particular column in a dataset
describe(Iris, :all, cols=:SepalLength)
Julia
# Using the DataFrames Package
using DataFrames

# Using the CSV package
using CSV

# Reading the CSV file
Iris = CSV.read("Iris.csv");

# Using Plots Package
using Plots

# Plot Histogram
Plots.histogram(Iris[:SepalLength],
                bins = 50, xlabel = "SepalLength",
                            labels = "Length in cm")
Julia
# Using the DataFrames Package
using DataFrames
# Using the CSV package
using CSV
# Reading the CSV file
Iris = CSV.read("Iris.csv");
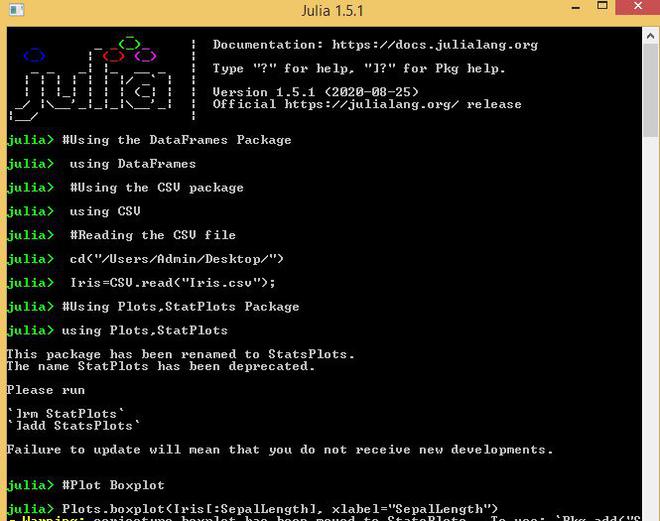
# Using Plots,StatPlots Package
using Plots, StatPlots
# Plot Boxplot
Plots.boxplot(Iris[:SepalLength],
xlabel = "SepalLength")Julia
# Using the DataFrames Package
using DataFrames
# Using the CSV package
using CSV
# Reading the CSV file
Iris = CSV.read("Iris.csv");
# Using Plots package
using Plots
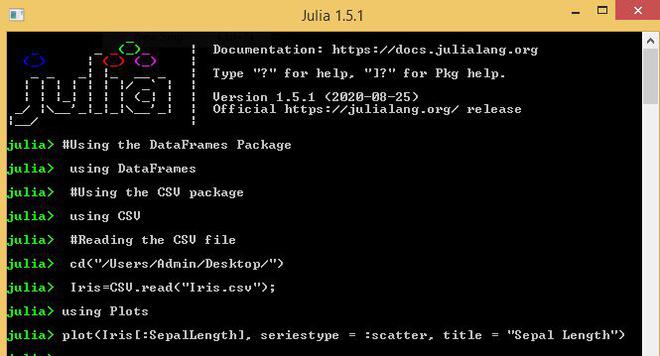
# Plot Scatterplot
plot(Iris[:SepalLength],
seriestype = :scatter,
title = "Sepal Length")输出:

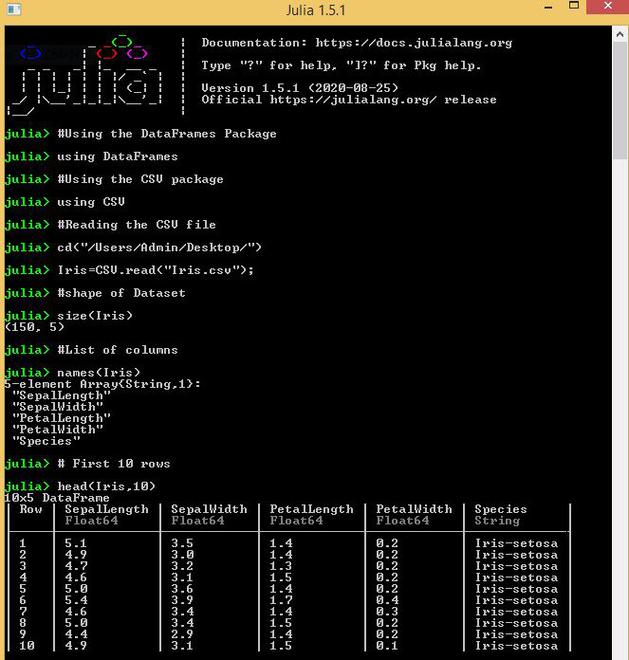
第 4 步:快速数据探索
可以对数据集进行初步探索,例如使用 size函数识别数据集的形状,使用名称函数识别列列表,使用 head函数识别前 n 行。
例子:
朱莉娅
# Using the DataFrames Package
using DataFrames

# Using the CSV package
using CSV

# Reading the CSV file
Iris = CSV.read(“Iris.csv”);

# Shape of Dataset
size(Iris)

# List of columns
names(Iris)

# First 10 rows
head(Iris, 10)
输出:
在数据框中索引
Dataframe_name[:column_name] 是访问数据框特定列的基本索引技术。
例子:
朱莉娅
# Using the DataFrames Package
using DataFrames

# Using the CSV package
using CSV

# Reading the CSV file
Iris = CSV.read(“Iris.csv”);

# Access particular column of dataset
Iris[: SepalLength]
输出:

描述函数
描述函数用于呈现数据集的均值、中值、最小值、最大值、四分位数等。
例子:
朱莉娅
# Using the DataFrames Package
using DataFrames

# Using the CSV package
using CSV

# Reading the CSV file
Iris = CSV.read(“Iris.csv”);

# Using describe function
# to get statistics of a dataset
describe(Iris)

# Using describe function to get
# statistics of a particular column in a dataset
describe(Iris, :all, cols=:SepalLength)
输出:

在数据上使用可视化绘图技术
Julia 中的可视化探索可以在各种绘图库(例如Plots 、 StatPlots和Pyplot )的帮助下实现。
Plots:它是一个高级绘图包,它与其他称为“后端”的绘图包接口。它们的行为类似于生成图形的图形引擎。它有一个简单而一致的界面。
StatPlots:它是一个与 Plots 包一起使用的支持包,由各种概念和类型的统计配方组成。
PyPlot:它用于在 Julia 中与Python的mathplotlib库一起使用。
可以使用以下命令安装上述库:
Pkg.add(“Plots”)
Pkg.add(“StatPlots”)
Pkg.add(“PyPlot”)
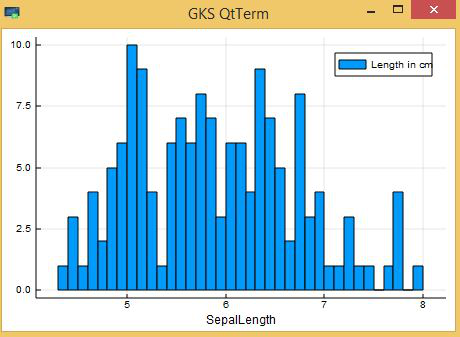
分布分析
Julia 中变量的分布可以使用各种图来执行,例如直方图、箱线图、散点图等。
让我们从绘制 SepalLength 的直方图开始:
例子:
朱莉娅
# Using the DataFrames Package
using DataFrames

# Using the CSV package
using CSV

# Reading the CSV file
Iris = CSV.read("Iris.csv");

# Using Plots Package
using Plots

# Plot Histogram
Plots.histogram(Iris[:SepalLength],
                bins = 50, xlabel = "SepalLength",
                            labels = "Length in cm")
输出:

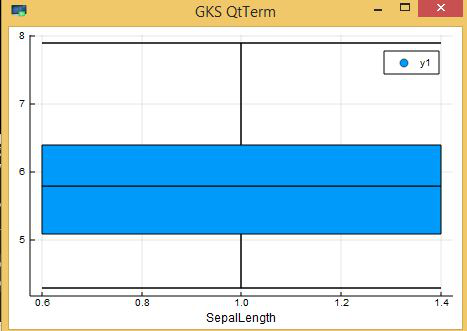
接下来,我们查看箱线图以了解分布。 SepalLength 的箱线图可以通过以下方式绘制:
例子:
朱莉娅
# Using the DataFrames Package
using DataFrames

# Using the CSV package
using CSV

# Reading the CSV file
Iris = CSV.read("Iris.csv");

# Using Plots,StatPlots Package
using Plots, StatPlots

# Plot Boxplot
Plots.boxplot(Iris[:SepalLength],
              xlabel = "SepalLength")
输出:
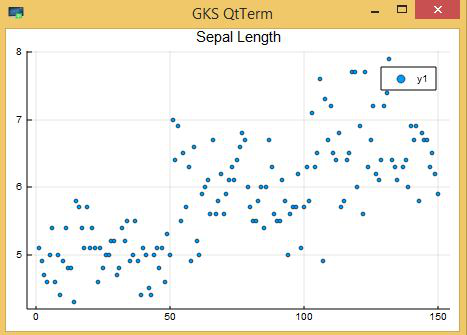
接下来,我们查看散点图以了解分布。 SepalLength 的散点图可以通过以下方式绘制:
例子:
朱莉娅
# Using the DataFrames Package
using DataFrames

# Using the CSV package
using CSV

# Reading the CSV file
Iris = CSV.read("Iris.csv");

# Using Plots package
using Plots

# Plot Scatterplot
plot(Iris[:SepalLength],
     seriestype = :scatter,
     title = "Sepal Length")
输出: