R中的正态分布
正态分布是统计中使用的概率函数,用于说明数据值的分布方式。它是统计中最重要的概率分布函数,因为它在实际案例场景中具有优势。例如,人口的身高、鞋码、智商水平、掷骰子等等。
通常观察到,当随机收集来自独立来源的数据时,数据分布是正常的。在 x 轴上绘制变量的值和在 y 轴上的值的计数后产生的图形是钟形曲线图。该图表示峰值点是数据集的平均值,数据集的一半值位于平均值的左侧,另一半位于平均值的右侧,说明值的分布。该图是对称分布。
在 R 中,有 4 个内置函数可以生成正态分布:
- 规范()
dnorm(x, mean, sd) - pnorm()
pnorm(x, mean, sd) - qnorm()
qnorm(p, mean, sd) - 规范()
rnorm(n, mean, sd)
在哪里,
– x represents the data set of values
– mean(x) represents the mean of data set x. It’s default value is 0.

– sd(x) represents the standard deviation of data set x. It’s default value is 1.

– n is the number of observations.
– p is vector of probabilities
在 R 中生成正态分布的函数
规范()
R 编程中的dnorm()函数测量分布的密度函数。在统计学中,它是通过以下公式来衡量的——

在哪里,  是平均数
是平均数 是标准差。
是标准差。
句法 :
dnorm(x, mean, sd)例子:
# creating a sequence of values
# between -15 to 15 with a difference of 0.1
x = seq(-15, 15, by=0.1)

y = dnorm(x, mean(x), sd(x))

# output to be present as PNG file
png(file="dnormExample.png")

# Plot the graph.
plot(x, y)

# saving the file
dev.off()
输出: 
pnorm()
pnorm()函数是累积分布函数,它测量随机数 X 取小于或等于 x 的值的概率,即在统计中它由下式给出:
![F_X(x) = Pr[X \le x] = \alpha](https://mangodoc.oss-cn-beijing.aliyuncs.com/geek8geeks/Normal_Distribution_in_R_6.png "由 QuickLaTeX.com 渲染")
句法:
pnorm(x, mean, sd)例子:
# creating a sequence of values
# between -10 to 10 with a difference of 0.1
x <- seq(-10, 10, by=0.1)

y <- pnorm(x, mean = 2.5, sd = 2)

# output to be present as PNG file
png(file="pnormExample.png")

# Plot the graph.
plot(x, y)

# saving the file
dev.off()
输出 : 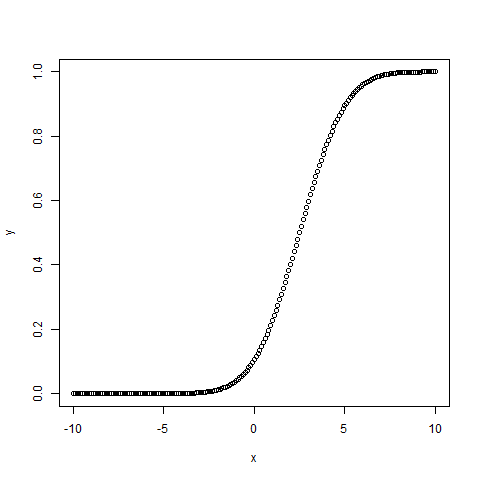
qnorm()
qnorm()函数是pnorm() () 函数的逆函数。它获取概率值并给出对应于概率值的输出。它可用于查找正态分布的百分位数。
句法:
qnorm(p, mean, sd)例子:
# Create a sequence of probability values
# incrementing by 0.02.
x <- seq(0, 1, by = 0.02)

y <- qnorm(x, mean(x), sd(x))

# output to be present as PNG file
png(file = "qnormExample.png")

# Plot the graph.
plot(x, y)

# Save the file.
dev.off()
输出: 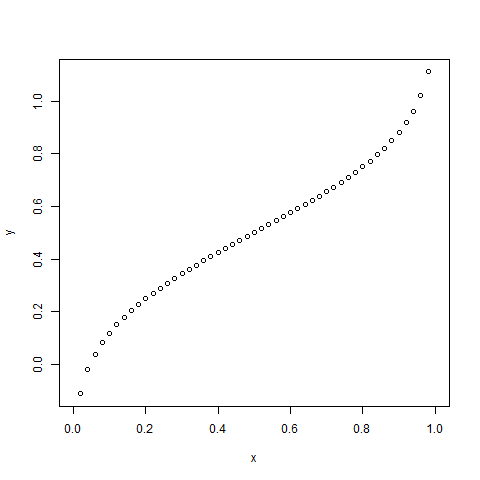
规范()
R 编程中的rnorm()函数用于生成正态分布的随机数向量。
句法:
rnorm(x, mean, sd)例子:
# Create a vector of 1000 random numbers
# with mean=90 and sd=5
x <- rnorm(10000, mean=90, sd=5)

# output to be present as PNG file
png(file = "rnormExample.png")

# Create the histogram with 50 bars
hist(x, breaks=50)

# Save the file.
dev.off()
输出 : 