📌 相关文章
- Python正态分布(1)
- 正态分布 - Python 代码示例
- R-正态分布
- R正态分布
- R-正态分布(1)
- R中的正态分布
- R正态分布(1)
- R中的正态分布(1)
- numpy 正态分布 - Python (1)
- numpy 正态分布 - Python 代码示例
- 绘制正态分布 python (1)
- 绘制正态分布 python 代码示例
- Python – 统计中的正态分布(1)
- Python – 统计中的幂正态分布
- Python – 统计中的偏正态分布(1)
- Python – 统计中的偏正态分布
- Python – 统计中的幂正态分布(1)
- Python – 统计中的正态分布
- 统计-正态分布
- scipy 检查正态分布 - Python (1)
- scipy 检查正态分布 - Python 代码示例
- 来自正态分布的 python 随机数 - Python (1)
- 来自正态分布的 python 随机数 - Python 代码示例
- 如何在Python中使用 Matplotlib 绘制正态分布?
- 使用 Numpy 和 Matplotlib 的正态分布图(1)
- 使用 Numpy 和 Matplotlib 的正态分布图
- Python – 统计中的对数正态分布
- Python – 统计中的对数正态分布(1)
- Python – 统计中的截断正态分布(1)
📜 Python正态分布
📅 最后修改于: 2020-12-13 14:20:25 🧑 作者: Mango
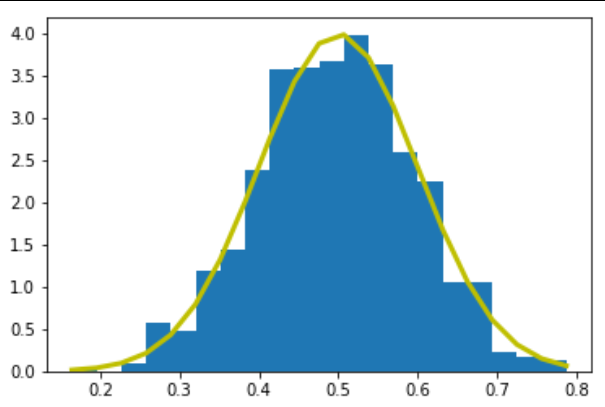
正态分布是通过排列数据中每个值的概率分布来呈现数据的形式,大多数值保持在平均值附近,从而使排列对称。
我们使用numpy库中的各种函数来数学计算正态分布的值。将创建直方图,在该直方图上绘制概率分布曲线。
import matplotlib.pyplot as plt
import numpy as np

mu, sigma = 0.5, 0.1
s = np.random.normal(mu, sigma, 1000)

# Create the bins and histogram
count, bins, ignored = plt.hist(s, 20, normed=True)

# Plot the distribution curve
plt.plot(bins, 1/(sigma * np.sqrt(2 * np.pi)) *
    np.exp( - (bins - mu)**2 / (2 * sigma**2) ),       linewidth=3, color='y')
plt.show()
其输出如下-