在 R 中使用 ggplot2 为连续变量创建箱线图
箱线图是总结分布形状的好方法,可以显示其中位数、均值、偏度、可能的异常值、分布等。箱线图是箱线图的另一个名称。这些图主要用于数据探索。箱线图是五数汇总,即最小值、第一四分位数、中位数、第三四分位数和最大值。
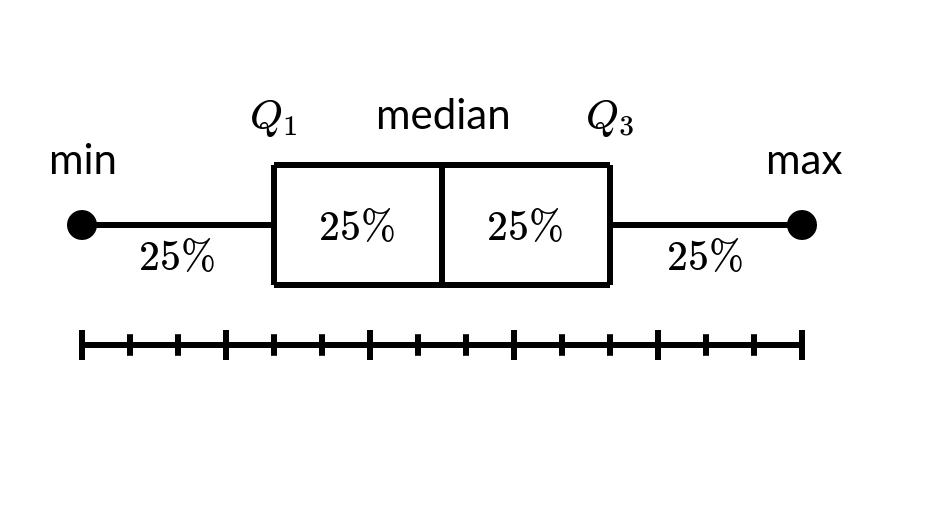
箱线图。
箱线图总结了一个连续变量的分布,我们从第一个四分位数到第三个四分位数画一个盒子,一条垂直线穿过中间的盒子,也就是第二个四分位数,将数据分成两个相等的 50%低于和 50 以上。第一个四分位数 (Q1)包括前 25% 的数据,第三个四分位数 (Q3)包括 75% 的数据。
使用来自 R 的 ggplot2 包中的 geom_boxplot()函数,我们可以创建一个简单的箱线图和连续变量的箱线图:
Syntax: geom_boxplot(mapping = NULL, data = NULL,position = “dodge”, outlier.colour = NULL, outlier.shape = 19, outlier.size = 1.5, outlier.stroke = 0.5, …)
Parameters:
- mapping: In this mapping we provide the column name as an argument to map onto the plot. The default mapping in geom_boxplot is NULL.
- data: This parameter sets the data frame to be used.
- position: position argument specify how the boxplot will be placed during the visual representation of the figure. The default value of the position is dodge.
- outlier.colour: Used to specifies specifies the default colour of the outlier.
- outlier.shape: Used to specifies specifies the default colour of the outlier.
- outlier.size: Used to specifies the default size of the outlier.
- outlier.stroke: we can hide the outliers from chart using the outlier.shape = NA it only hides the outlier, it doesn’t remove the outlier.
要为连续变量创建箱线图,首先,安装绘制箱线图所需的包,然后创建或加载我们要绘制箱线图的数据集。使用 geom_boxplot()函数绘制箱线图,就像常规箱线图一样。
示例 1:
R
# loading library
library(ggplot2)

# creating random dataset
data <- data.frame(y=abs(rnorm(16)),
                   x=rep(c(0,100,200,300,400,
                           500,600,700),
                         each=2))

# creating the box plot
ggplot(data, aes(x, y, group=x)) +

# plotting the box plot with green color
geom_boxplot(fill="green") +

# adding x-axis label
xlab("x-axis") +

# adding y-axis label
ylab("y-axis") +

# adding title
ggtitle("Continuous Box plot ")
R
# creating box plot for continuous variable
# loading library
library(ggplot2)

# creating random dataset
data <- data.frame(y=abs(rnorm(20)),
                   x=rep(c(10,20,30,40,50,60,
                           70,80,90,100),
                         each=2))

# creating the box plot
ggplot(data, aes(x, y, fill=factor(x))) +

  # plotting the box plot with green color
  geom_boxplot() +

  # adding x-axis label
  xlab("x-axis") +

  # adding y-axis label
  ylab("y-axis") +

  # adding title
  ggtitle("Continuous Box plot ")
输出:
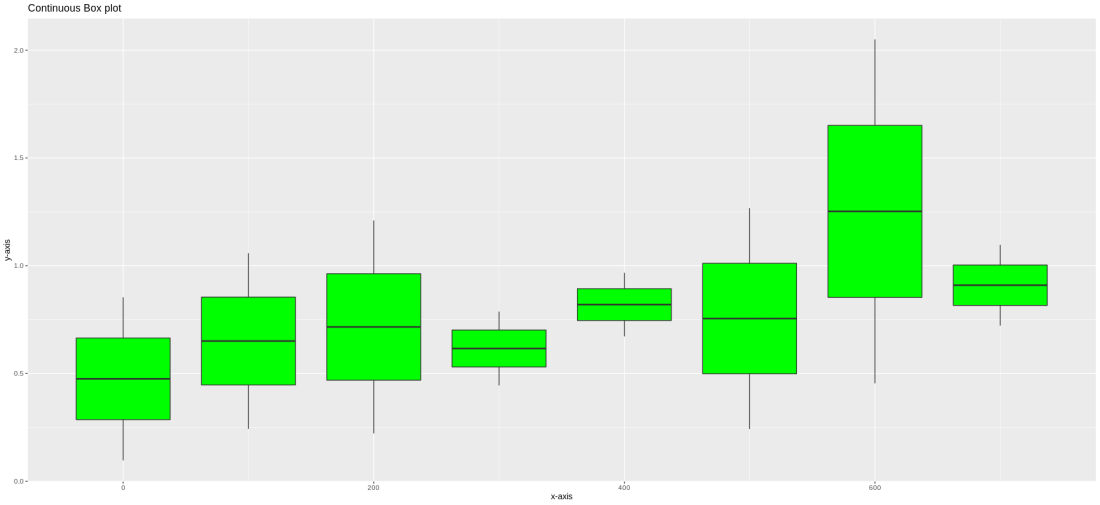
箱形图
示例 2:
电阻
# creating box plot for continuous variable
# loading library
library(ggplot2)

# creating random dataset
data <- data.frame(y=abs(rnorm(20)),
                   x=rep(c(10,20,30,40,50,60,
                           70,80,90,100),
                         each=2))

# creating the box plot
ggplot(data, aes(x, y, fill=factor(x))) +

  # plotting the box plot with green color
  geom_boxplot() +

  # adding x-axis label
  xlab("x-axis") +

  # adding y-axis label
  ylab("y-axis") +

  # adding title
  ggtitle("Continuous Box plot ")
输出:
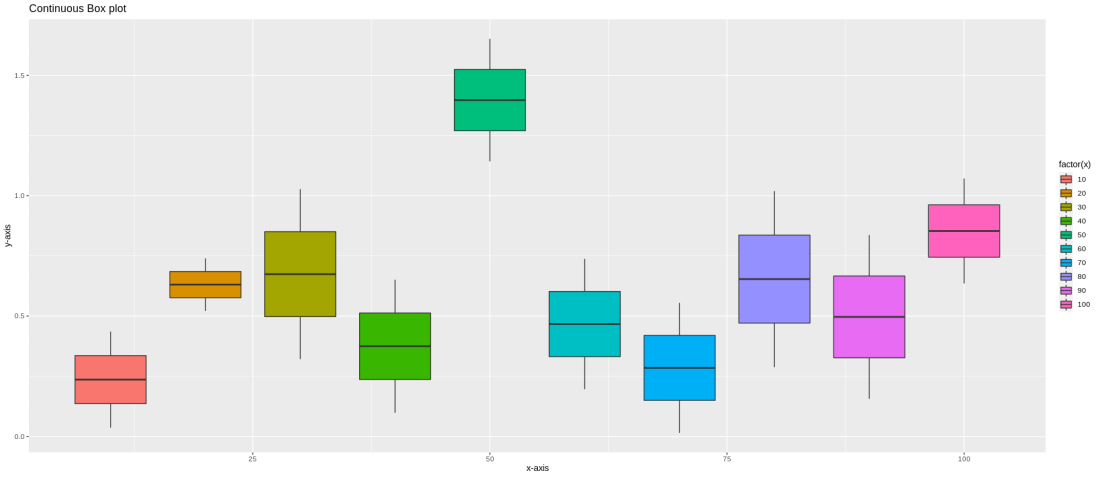
彩色箱线图