毫升 |在 K-Means 聚类中确定 K 的最优值
先决条件:K-Means 聚类 |介绍
有一种流行的方法称为肘法,用于确定 K 的最佳值以执行 K-Means 聚类算法。这种方法背后的基本思想是它绘制了随着k变化的各种成本值。随着K值的增加,簇中的元素将减少。所以平均失真会减少。元素数量越少意味着越靠近质心。因此,这种失真下降最多的点是肘点。
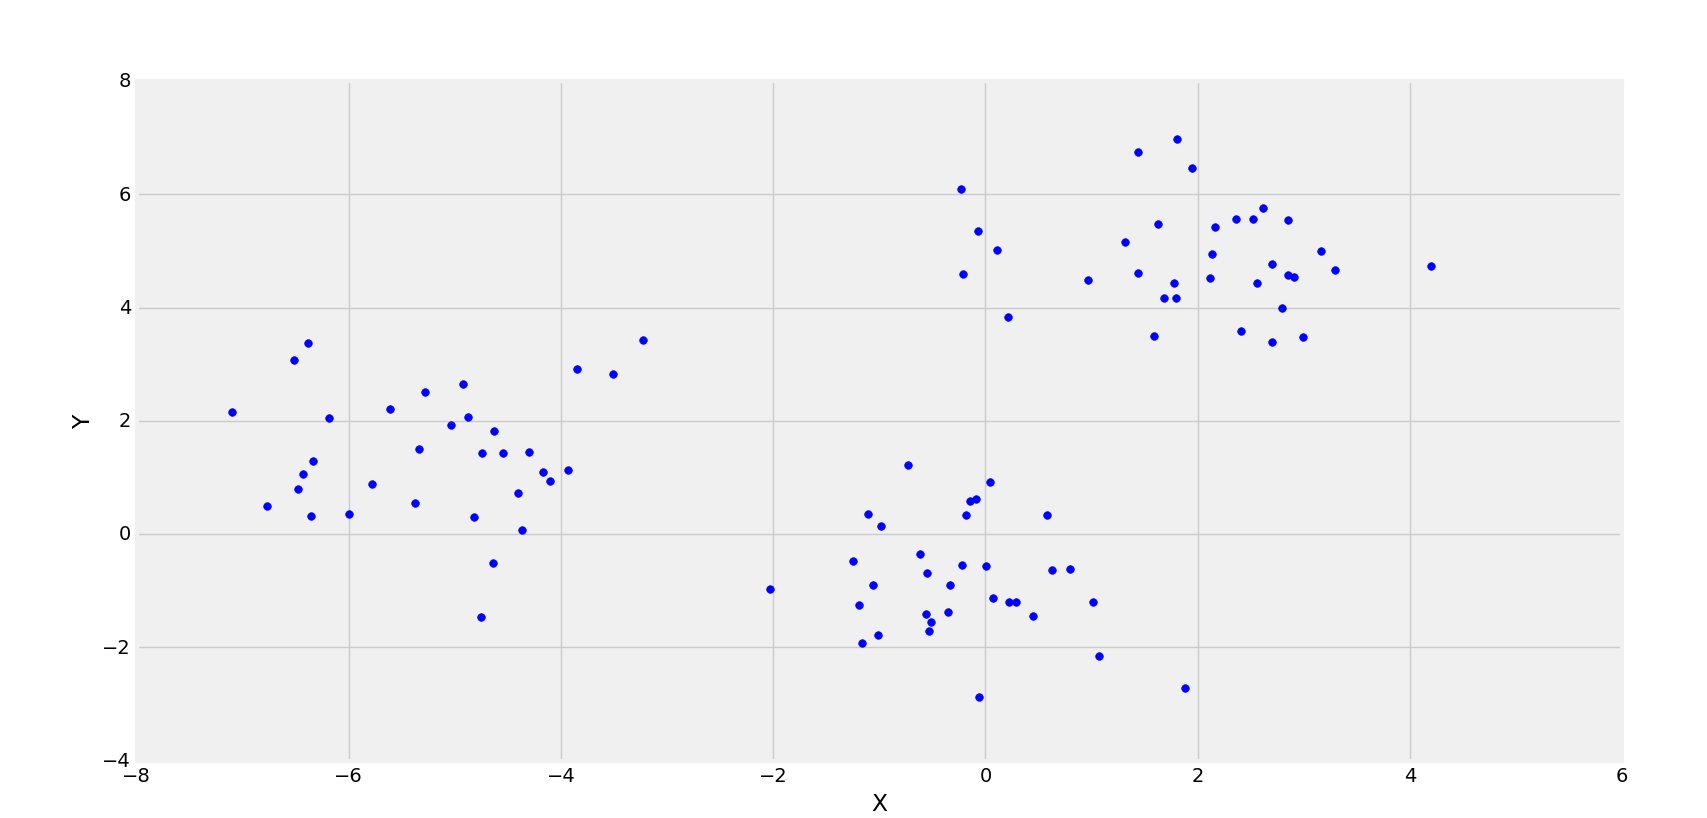
3个集群正在形成
在上图中,可以清楚地观察到点的分布正在形成 3 个簇。现在,让我们看看不同 K 值的平方误差 (Cost) 的图。
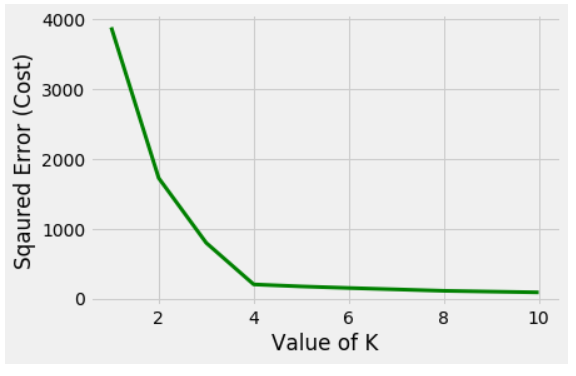
弯头在 K=3 处形成
很明显,弯头在 K=3 处形成。因此,执行 K-Means 的最佳值将是 3。
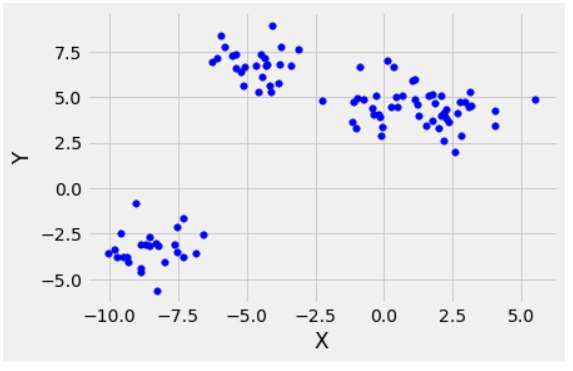
另一个有 4 个集群的示例。
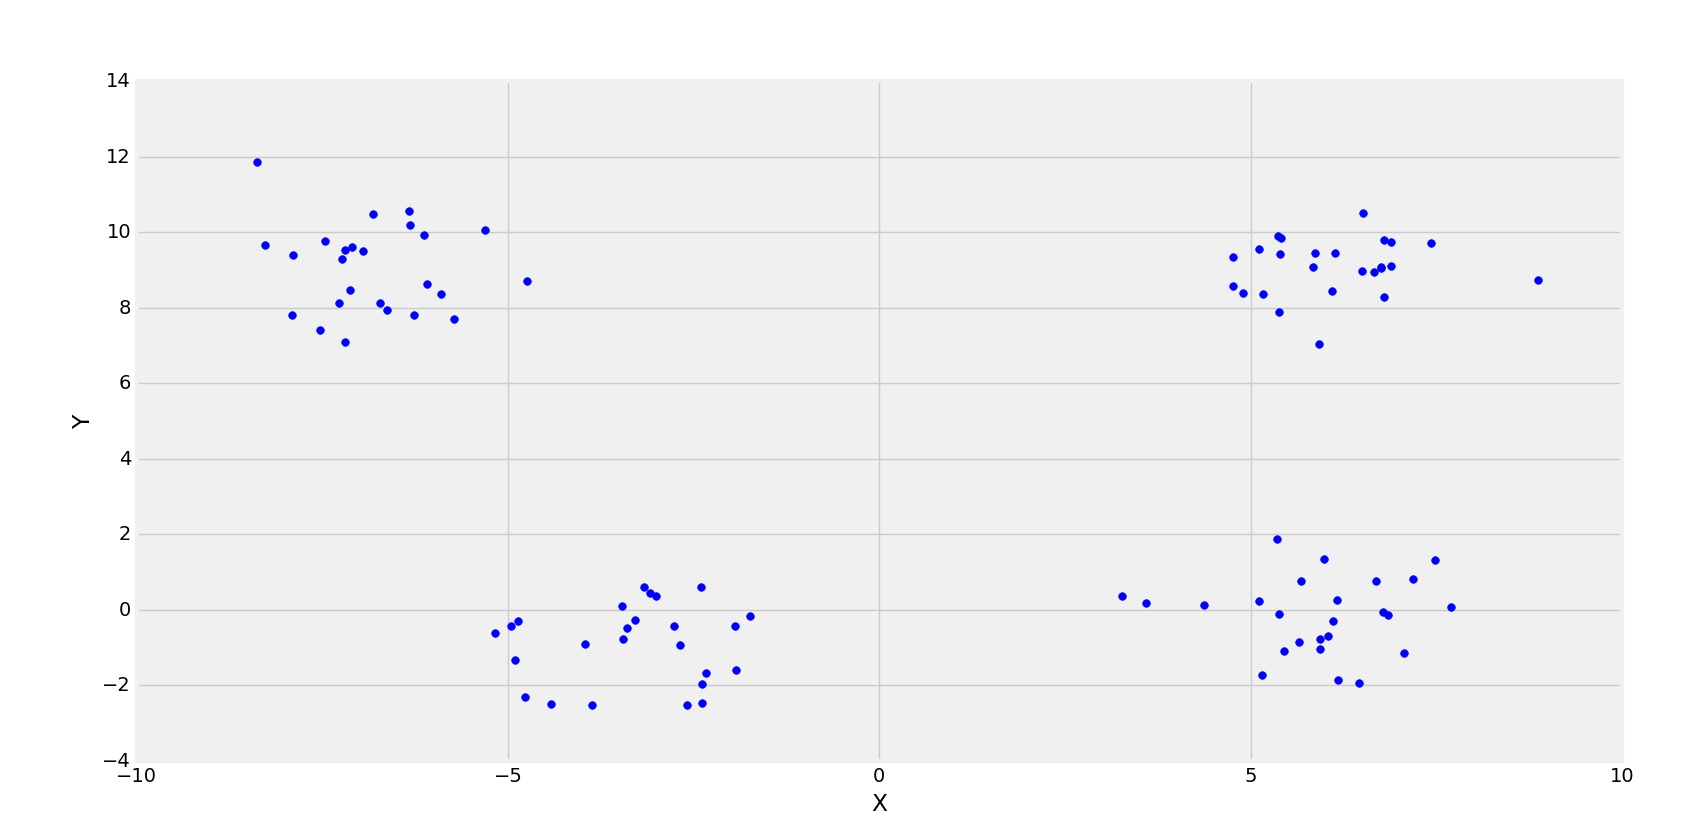
4 集群
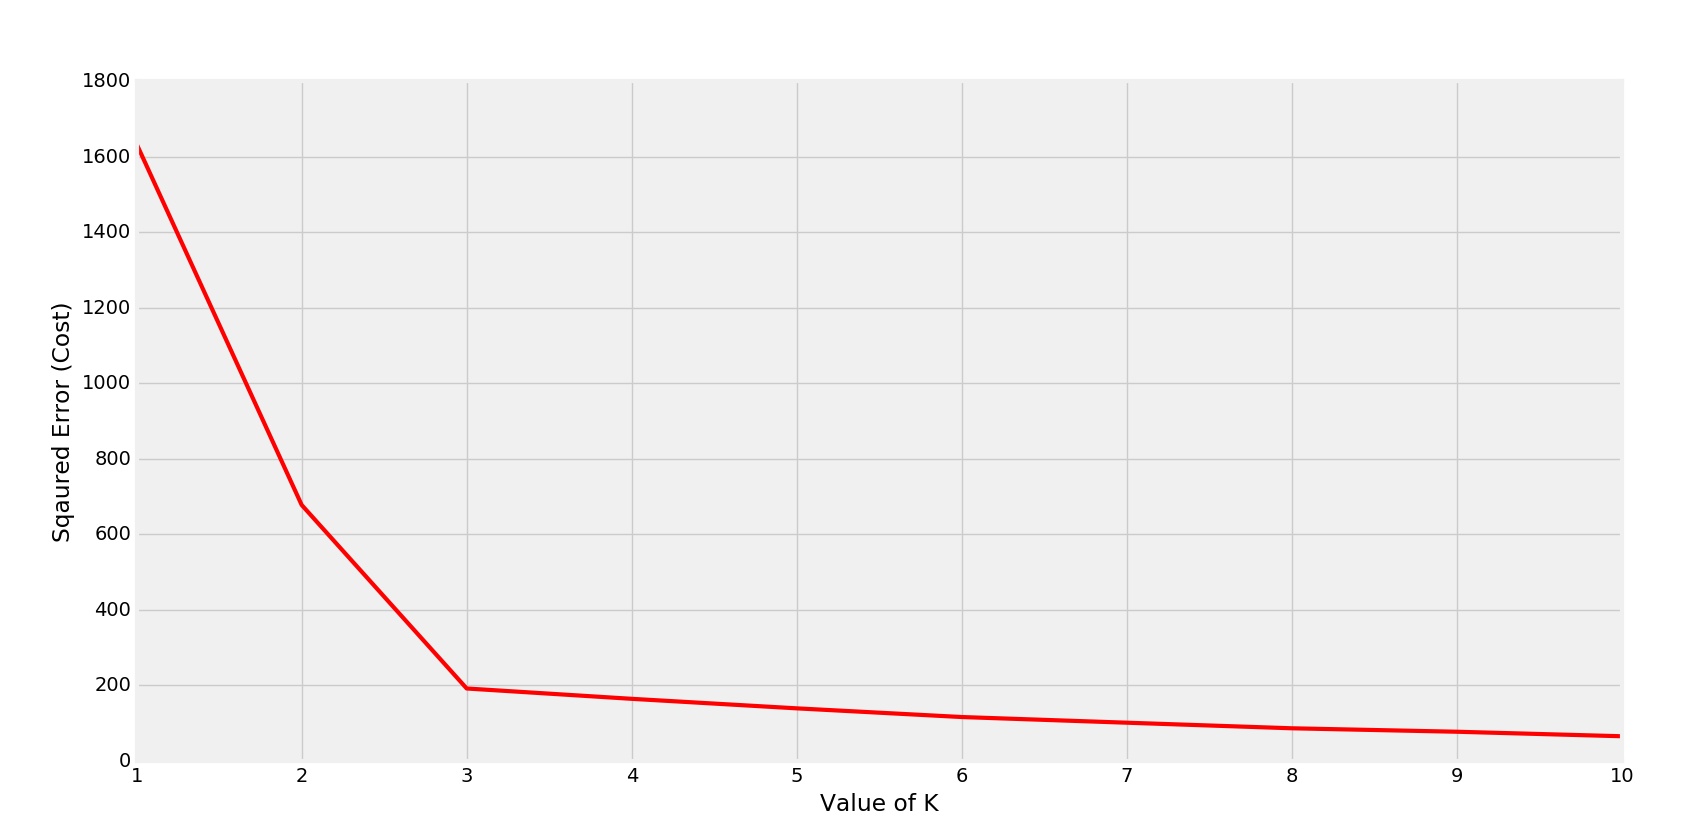
相应的成本图-
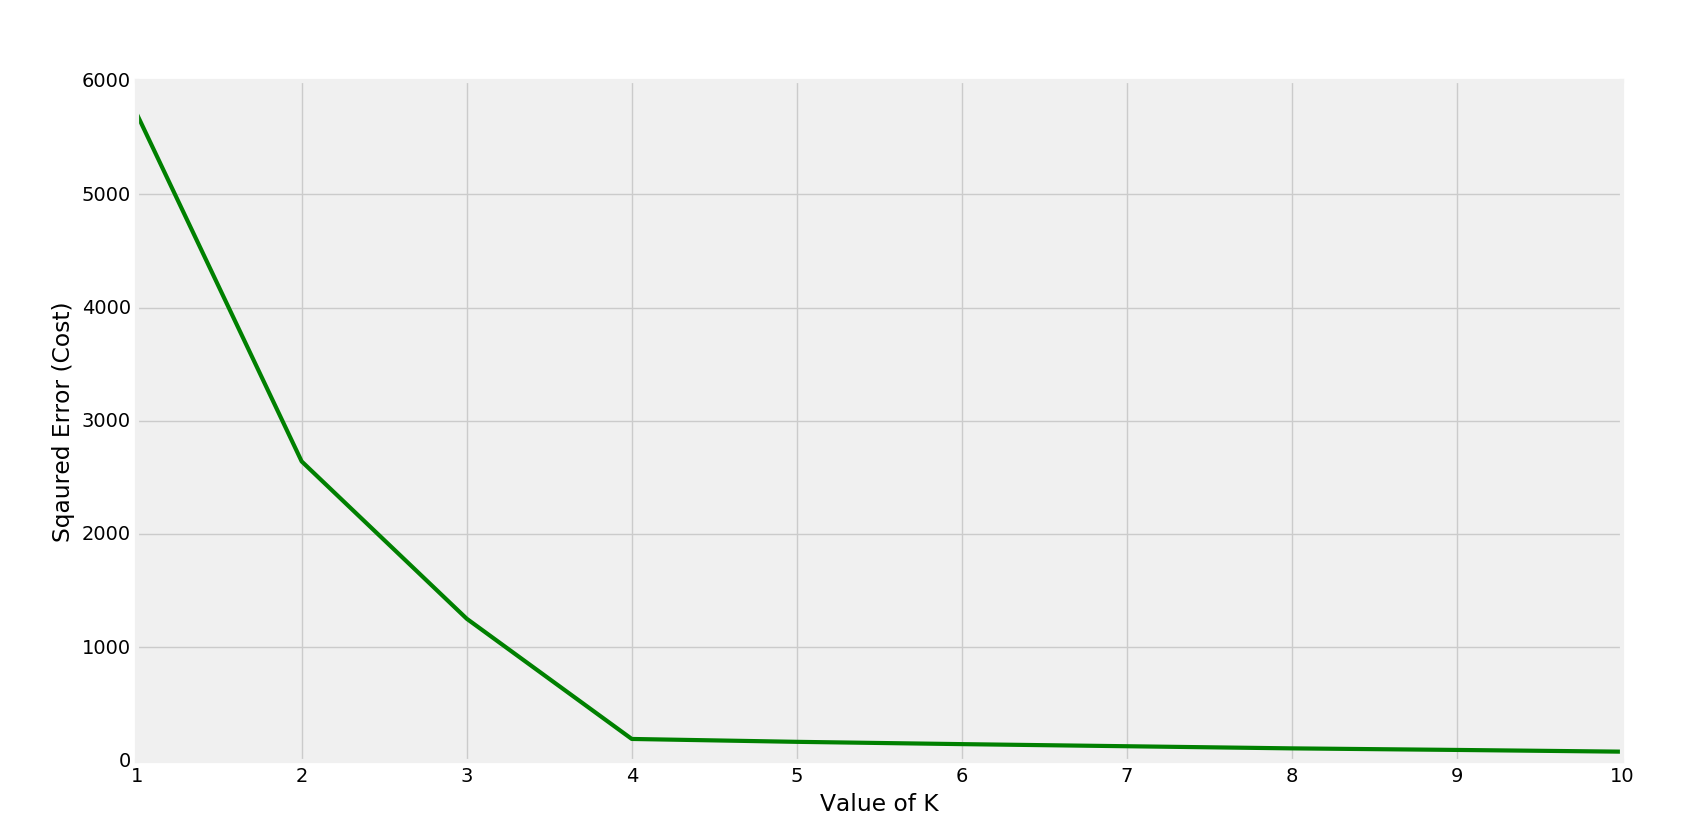
弯头在 K=4 处形成
在这种情况下,k 的最佳值为 4。(可从散点观察到)。
下面是Python的实现:
Python3
import matplotlib.pyplot as plt
from matplotlib import style
from sklearn.cluster import KMeans
from sklearn.datasets.samples_generator import make_blobs

style.use("fivethirtyeight")

# make_blobs() is used to generate sample points
# around c centers (randomly chosen)
X, y = make_blobs(n_samples = 100, centers = 4,
                cluster_std = 1, n_features = 2)

plt.scatter(X[:, 0], X[:, 1], s = 30, color ='b')

# label the axes
plt.xlabel('X')
plt.ylabel('Y')

plt.show()
plt.clf() # clear the figure
Python3
cost =[]
for i in range(1, 11):
    KM = KMeans(n_clusters = i, max_iter = 500)
    KM.fit(X)

    # calculates squared error
    # for the clustered points
    cost.append(KM.inertia_)

# plot the cost against K values
plt.plot(range(1, 11), cost, color ='g', linewidth ='3')
plt.xlabel("Value of K")
plt.ylabel("Squared Error (Cost)")
plt.show() # clear the plot

# the point of the elbow is the
# most optimal value for choosing k
输出: