R 编程中的 K-Means 聚类
R 编程中的 K 均值聚类是一种无监督非线性算法,它基于相似性或相似组对数据进行聚类。它试图将观察结果划分为预先指定数量的集群。进行数据分割以将每个训练示例分配给称为集群的段。在无监督算法中,高度依赖原始数据,并在人工审查方面花费大量资金来审查相关性。它用于银行,医疗保健,零售,媒体等各个领域。
理论
K-Means 聚类对相似组的数据进行分组。算法如下:
- 选择数量为K的簇。
- 随机选择 K 个点,质心(不一定来自给定数据)。
- 将每个数据点分配给形成 K 个集群的最近质心。
- 计算并放置每个质心的新质心。
- 将每个数据点重新分配给新集群。
最终重新分配后,将集群命名为最终集群。
数据集
Iris数据集由来自 3 种鸢尾花(Iris setosa、Iris virginica、Iris versicolor)中的每一种的 50 个样本和英国统计学家和生物学家 Ronald Fisher 在其 1936 年论文 The use of multiple measurement in taxonomic questions 中引入的多元数据集组成。从每个样本中测量了四个特征,即萼片和花瓣的长度和宽度,基于这四个特征的组合,Fisher 开发了一个线性判别模型来区分物种。
# Loading data
data(iris)

# Structure
str(iris)
对数据集执行 K-Means 聚类
在包含 11 个人和 6 个变量或属性的数据集上使用 K-Means 聚类算法
# Installing Packages
install.packages("ClusterR")
install.packages("cluster")

# Loading package
library(ClusterR)
library(cluster)

# Removing initial label of
# Species from original dataset
iris_1 <- iris[, -5]

# Fitting K-Means clustering Model
# to training dataset
set.seed(240) # Setting seed
kmeans.re <- kmeans(iris_1, centers = 3, nstart = 20)
kmeans.re

# Cluster identification for
# each observation
kmeans.re$cluster

# Confusion Matrix
cm <- table(iris$Species, kmeans.re$cluster)
cm

# Model Evaluation and visualization
plot(iris_1[c("Sepal.Length", "Sepal.Width")])
plot(iris_1[c("Sepal.Length", "Sepal.Width")],
     col = kmeans.re$cluster)
plot(iris_1[c("Sepal.Length", "Sepal.Width")],
     col = kmeans.re$cluster,
     main = "K-means with 3 clusters")

## Plotiing cluster centers
kmeans.re$centers
kmeans.re$centers[, c("Sepal.Length", "Sepal.Width")]

# cex is font size, pch is symbol
points(kmeans.re$centers[, c("Sepal.Length", "Sepal.Width")],
       col = 1:3, pch = 8, cex = 3)

## Visualizing clusters
y_kmeans <- kmeans.re$cluster
clusplot(iris_1[, c("Sepal.Length", "Sepal.Width")],
         y_kmeans,
         lines = 0,
         shade = TRUE,
         color = TRUE,
         labels = 2,
         plotchar = FALSE,
         span = TRUE,
         main = paste("Cluster iris"),
         xlab = 'Sepal.Length',
         ylab = 'Sepal.Width')
输出:
- 型号 kmeans_re:

制作了 3 个集群,分别为 50、62 和 38 大小。在集群内,平方和为 88.4%。
- 集群识别:

该模型实现了 100% 的准确度,p 值小于 1。这表明该模型是好的。
- 混淆矩阵:

因此,50 个 Setosa 被正确归类为 Setosa。在 62 个 Versicolor 中,48 个 Versicolor 被正确归类为 Versicolor,14 个被归类为Virginica。在 36 个Virginica 中,19 个 virginica 被正确归类为 virginica,2 个被归类为 Versicolor。
- 具有 3 个聚类图的 K 均值:

该模型显示了 3 个具有三种不同颜色、Sepal.length 和 Sepal.width 的聚类图。
- 绘制聚类中心:
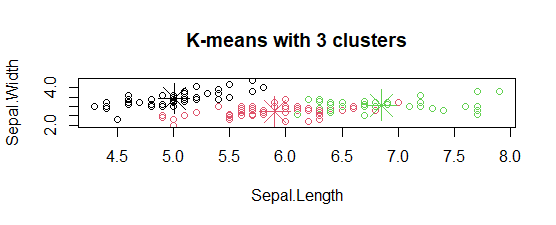
在图中,聚类中心用与聚类相同颜色的十字符号标记。
- 集群图:

因此,形成了 3 个具有不同萼片长度和萼片宽度的簇。因此,K-Means 聚类算法在业界得到广泛应用。