MATLAB 中的二维线图
“2D”代表二维,二维线是在二维中移动的线。 2D 中的一条线意味着我们可以向前和向后移动,也可以向左、右、上、下等任何方向移动。
在 MATLAB 中,我们有一个名为plot()的函数,它允许我们在 2 个方向上绘制一条线。
句法:
plot(X,Y)
where X and Y represent the x and the y axis of the plane. The X and Y both are can be vectors or matrices but there are some conditions to plot the graph and these conditions are mentioned below:
Condition 1: If X and Y both are vectors then they must be of equal length.
Condition 2: If X and Y both are Matrices then they must be of equal size.
Condition 3: If one of X or Y is a vector and the other is a matrix, then the matrix must have dimensions such that one of its dimensions equals the vector length.
Condition 4: If one is a scalar and the other is either a scalar or a vector, then discrete points must be plotted.
现在让我们来看一些例子。
例 1:画一条简单的线:
MATLAB
% coordinates of the x-axis
x=[10,20,30,40,50]

% coordinates of the y-axis
y=[100,200,300,400,500]

% plot function is used to plot the
% line according to the coordinates
plot(x,y)

% to put grid on the graph
grid on
MATLAB
% coordinates of axis
y=[100,200,300,400,500]

% plot function is used to plot the
% line according to the coordinates
plot(x,y)

% to put grid on the graph
grid on
MATLAB
% coordinates of x-axis
x=[10,20,30,40,50]

% coordinates of y-axis of line 1
% represented by blue color
y1=[100,500,200,100,0]

% coordinates of y-axis of line 2
% represented by red color
y2=[400,100,0,200,300]

% coordinates of y-axis of line 3
% represented by yellow color
y3=[200,300,400,100,500]

% plot function to plot the lines on graph
plot(x,y1,x,y2,x,y3)

% to add grid on graph
grid on

% name of x axis
xlabel('x')

% name of y axis
ylabel('y')
MATLAB
% coordinates of x-axis
x=[1,2,3,4,5]

% coordinates of y-axis in form of matrix
% magic(n) matrix is a n*n matrix
% in which value scattered from 1 to n^2
% with equal row and columns sum
y=magic(5)

% plot function
plot(x,y)

% to add grid
grid on

% add name on axis
xlabel('x')
ylabel('y')
MATLAB
% coordinates of x-axis
x=[1,2,3,4,5]

% coordinates of y-axis
y=[50,40,30,20,10]

% assigning left side to the above
% coordinates
yyaxis left

% plot graph of left y-axis
plot(x,y)

% coordinates of y-axis
y=[10,20,30,40,50]

% assigning right side to the above
% coordinates
yyaxis right

% plot graph of right y-axis
plot(x,y)

% put grid on graph
grid on

% name of x-axis
xlabel('x')

% name of left side y coordinates
yyaxis left
ylabel('Left Side')

% name of right side y coordinates
yyaxis right
ylabel('Right Side')
输出 :

示例 2:绘制一条只有 1 个轴坐标作为输入的线:
注意:如果您只给出 1 个轴,则 plot()函数会将其作为 y 轴的坐标,并且默认情况下为 x 轴提供从 1、2、3 到 y 坐标的值。
MATLAB
% coordinates of axis
y=[100,200,300,400,500]

% plot function is used to plot the
% line according to the coordinates
plot(x,y)

% to put grid on the graph
grid on
输出 :

示例 3:在具有轴名称的同一图形上绘制 1 条以上的线:
MATLAB
% coordinates of x-axis
x=[10,20,30,40,50]

% coordinates of y-axis of line 1
% represented by blue color
y1=[100,500,200,100,0]

% coordinates of y-axis of line 2
% represented by red color
y2=[400,100,0,200,300]

% coordinates of y-axis of line 3
% represented by yellow color
y3=[200,300,400,100,500]

% plot function to plot the lines on graph
plot(x,y1,x,y2,x,y3)

% to add grid on graph
grid on

% name of x axis
xlabel('x')

% name of y axis
ylabel('y')
输出 :

示例 4:现在 y 轴的值作为矩阵而不是向量给出:
MATLAB
% coordinates of x-axis
x=[1,2,3,4,5]

% coordinates of y-axis in form of matrix
% magic(n) matrix is a n*n matrix
% in which value scattered from 1 to n^2
% with equal row and columns sum
y=magic(5)

% plot function
plot(x,y)

% to add grid
grid on

% add name on axis
xlabel('x')
ylabel('y')
输出:

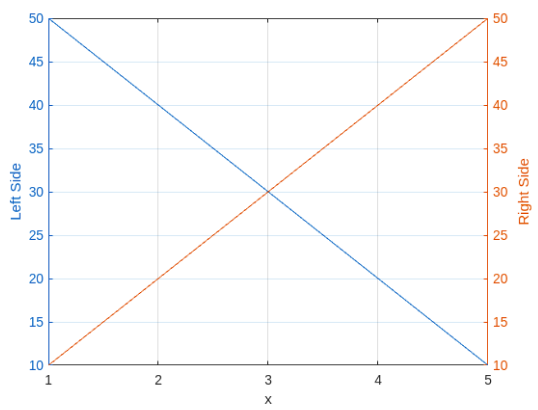
示例 5:现在我们使用 2 y 轴绘制图形,一个在左侧,另一个在右侧。
MATLAB
% coordinates of x-axis
x=[1,2,3,4,5]

% coordinates of y-axis
y=[50,40,30,20,10]

% assigning left side to the above
% coordinates
yyaxis left

% plot graph of left y-axis
plot(x,y)

% coordinates of y-axis
y=[10,20,30,40,50]

% assigning right side to the above
% coordinates
yyaxis right

% plot graph of right y-axis
plot(x,y)

% put grid on graph
grid on

% name of x-axis
xlabel('x')

% name of left side y coordinates
yyaxis left
ylabel('Left Side')

% name of right side y coordinates
yyaxis right
ylabel('Right Side')
输出: