在Python中使用 Seaborn 的 Swarmplot
Seaborn 是一个惊人的Python统计图形绘图可视化库。它提供了漂亮的默认样式和调色板,使统计图更具吸引力。它建立在 matplotlib 库之上,并紧密集成到 pandas 的数据结构中。
群体图
Seaborn swarmplot 可能类似于 stripplot,只是调整了点,因此它不会相互重叠,因为它有助于更好地表示值的分布。群图可以自己绘制,但它也是框的一个很好的补充,因为关联的名称将用于注释轴。这种情节有时被称为“蜂群”。
Syntax: seaborn.swarmplot(x=None, y=None, hue=None, data=None, order=None, hue_order=None, dodge=False, orient=None, color=None, palette=None, size=5, edgecolor=’gray’, linewidth=0, ax=None, **kwargs)
Parameters:
x, y, hue: Inputs for plotting long-form data.
data: Dataset for plotting.
color: Color for all of the elements
size: Radius of the markers, in points.
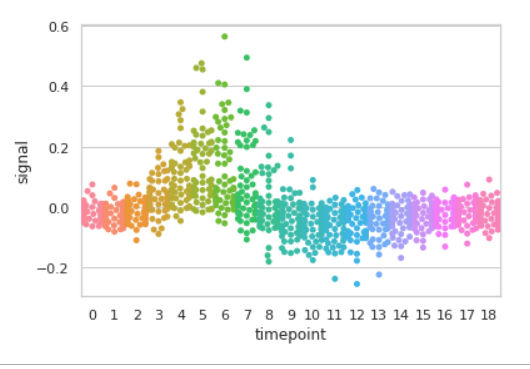
示例 1:使用 swarmplot() 对“fmri”数据集进行基本可视化
Python3
import seaborn


seaborn.set(style='whitegrid')
fmri = seaborn.load_dataset("fmri")

seaborn.swarmplot(x="timepoint",
                  y="signal",
                  data=fmri)
Python3
import seaborn


seaborn.set(style='whitegrid')
fmri = seaborn.load_dataset("fmri")

seaborn.swarmplot(x="timepoint",
                  y="signal",
                  hue="region",
                  data=fmri)
Python3
import seaborn


seaborn.set(style='whitegrid')
tip = seaborn.load_dataset('tips')

seaborn.swarmplot(x='day', y='tip', data=tip)
Python3
# Python program to illustrate
# swarmplot using inbuilt data-set
# given in seaborn

# importing the required module
import seaborn

# use to set style of background of plot
seaborn.set(style="whitegrid")

# loading data-set
tips = seaborn.load_dataset("tips")

seaborn.swarmplot(x=tips["total_bill"])
Python3
# Python program to illustrate
# swarmplot using inbuilt data-set
# given in seaborn

# importing the required module
import seaborn

# use to set style of background of plot
seaborn.set(style="whitegrid")

# loading data-set
tips = seaborn.load_dataset("tips")

seaborn.swarmplot(x="total_bill", y="day", data=tips)
Python3
# Python program to illustrate
# swarmplot using inbuilt data-set
# given in seaborn

# importing the required module
import seaborn

# use to set style of background of plot
seaborn.set(style="whitegrid")

# loading data-set
tips = seaborn.load_dataset("tips")

seaborn.swarmplot(x="day", y="total_bill", hue="time", data=tips)
Python3
# Python program to illustrate
# swarmplot using inbuilt data-set
# given in seaborn

# importing the required module
import seaborn

# use to set style of background of plot
seaborn.set(style="whitegrid")

# loading data-set
tips = seaborn.load_dataset("tips")

seaborn.swarmplot(x="day", y="total_bill", data=tips,
                   linewidth=2)
Python3
seaborn.swarmplot(y="total_bill", x="day", data=tips,
                   linewidth=2,edgecolor='green')
Python3
# Python program to illustrate
# swarmplot using inbuilt data-set
# given in seaborn

# importing the required module
import seaborn

# use to set style of background of plot
seaborn.set(style="whitegrid")

# loading data-set
tips = seaborn.load_dataset("tips")

seaborn.swarmplot(x="day", y="total_bill", hue="smoker",
                   data=tips, palette="Set2", dodge=True)
Python3
# Python program to illustrate
# swarmplot using inbuilt data-set
# given in seaborn

# importing the required module
import seaborn

# use to set style of background of plot
seaborn.set(style="whitegrid")

# loading data-set
tips = seaborn.load_dataset("tips")

seaborn.swarmplot(x="day", y="total_bill", hue="smoker",
                   data=tips, palette="Set2", size=20, marker="D",
                   edgecolor="gray", alpha=.25)
Python3
# Python program to illustrate
# swarmplot using inbuilt data-set
# given in seaborn

# importing the required module
import seaborn

# use to set style of background of plot
seaborn.set(style="whitegrid")

# loading data-set
tips = seaborn.load_dataset("tips")

seaborn.swarmplot(x="time", y="tip", data=tips,
                   order=["Dinner", "Lunch"])
Python3
# Python program to illustrate
# swarmplot using inbuilt data-set
# given in seaborn

# importing the required module
import seaborn

# use to set style of background of plot
seaborn.set(style="whitegrid")

# loading data-set
tips = seaborn.load_dataset("tips")

seaborn.swarmplot(x='day', y='total_bill', data=tips,
                  hue='smoker', size=10)
Python3
# Python program to illustrate
# swarmplot using inbuilt data-set
# given in seaborn

# importing the required module
import seaborn

# use to set style of background of plot
seaborn.set(style="whitegrid")

# loading data-set
tips = seaborn.load_dataset("tips")

seaborn.swarmplot(x='day', y='total_bill', data=tips,
                  hue='time', palette='pastel')
输出:
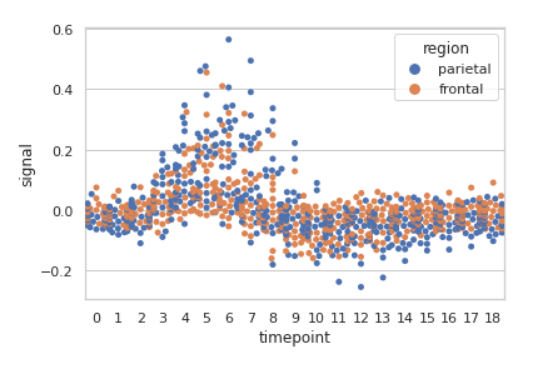
示例 2:根据类别对数据点进行分组,此处为区域和事件。
Python3
import seaborn


seaborn.set(style='whitegrid')
fmri = seaborn.load_dataset("fmri")

seaborn.swarmplot(x="timepoint",
                  y="signal",
                  hue="region",
                  data=fmri)
输出:
示例 3:使用 swarmplot() 对“tips”数据集进行基本可视化
Python3
import seaborn


seaborn.set(style='whitegrid')
tip = seaborn.load_dataset('tips')

seaborn.swarmplot(x='day', y='tip', data=tip)
输出:

Seaborn Swarmplot中具有不同属性的变量分组
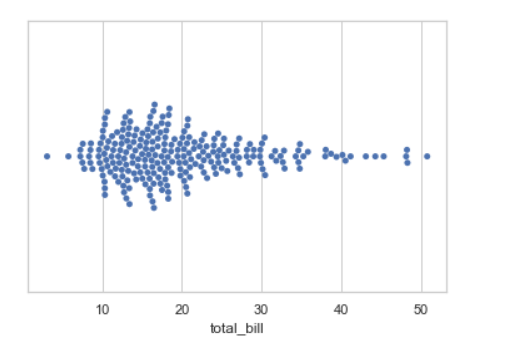
1. 仅使用一个轴绘制单个水平群图:
如果我们只使用一个数据变量而不是两个数据变量,那么这意味着轴将这些数据变量中的每一个都表示为一个轴。
X表示x轴,y表示y轴。
句法:
seaborn.swarmplot(x)
Python3
# Python program to illustrate
# swarmplot using inbuilt data-set
# given in seaborn

# importing the required module
import seaborn

# use to set style of background of plot
seaborn.set(style="whitegrid")

# loading data-set
tips = seaborn.load_dataset("tips")

seaborn.swarmplot(x=tips["total_bill"])
输出:
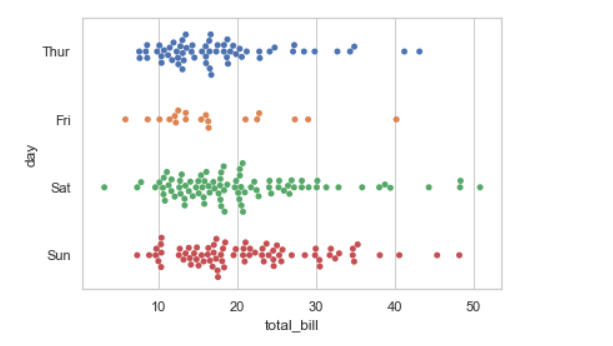
2.画水平群:
在上面的例子中,我们看到了如何绘制单个水平群图,在这里可以执行多个水平群图,并与另一个轴交换数据变量。
Python3
# Python program to illustrate
# swarmplot using inbuilt data-set
# given in seaborn

# importing the required module
import seaborn

# use to set style of background of plot
seaborn.set(style="whitegrid")

# loading data-set
tips = seaborn.load_dataset("tips")

seaborn.swarmplot(x="total_bill", y="day", data=tips)
输出:
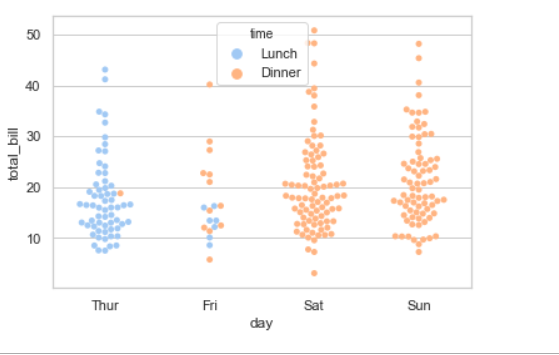
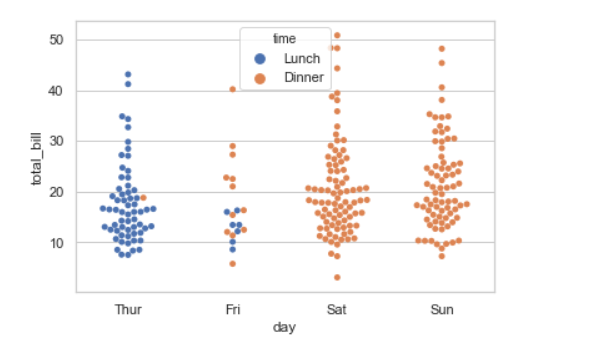
3.使用色调参数:
虽然点是在二维中绘制的,但可以通过根据第三个变量对点着色来将另一个维度添加到图中。
句法:
sns.swarmplot(x, y, hue, data);
Python3
# Python program to illustrate
# swarmplot using inbuilt data-set
# given in seaborn

# importing the required module
import seaborn

# use to set style of background of plot
seaborn.set(style="whitegrid")

# loading data-set
tips = seaborn.load_dataset("tips")

seaborn.swarmplot(x="day", y="total_bill", hue="time", data=tips)
输出:
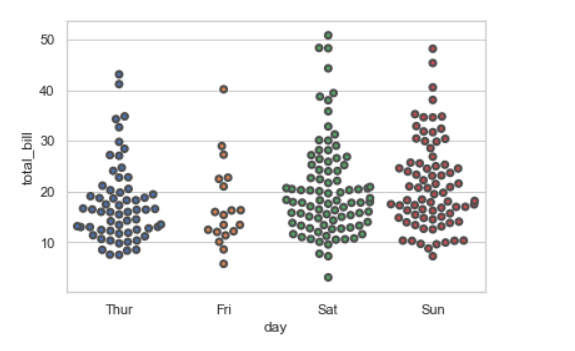
4. 使用线宽在数据点周围绘制轮廓:
构成绘图元素的灰线的宽度。每当我们增加线宽时,点也会自动增加。
句法:
seaborn.swarmplot(x, y, data, linewidth)
Python3
# Python program to illustrate
# swarmplot using inbuilt data-set
# given in seaborn

# importing the required module
import seaborn

# use to set style of background of plot
seaborn.set(style="whitegrid")

# loading data-set
tips = seaborn.load_dataset("tips")

seaborn.swarmplot(x="day", y="total_bill", data=tips,
                   linewidth=2)
输出:
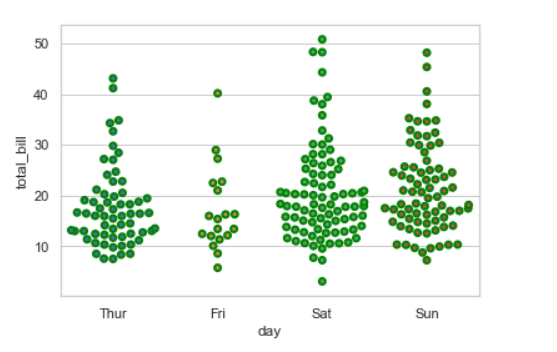
我们可以用edgecolor 改变颜色:
Python3
seaborn.swarmplot(y="total_bill", x="day", data=tips,
                   linewidth=2,edgecolor='green')
输出:
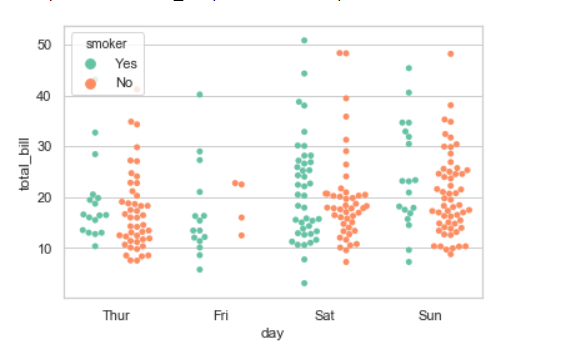
5. 在主分类轴上的不同位置绘制色调变量的每个级别:
使用色调嵌套时,设置 dodge 应为 True 将沿分类轴分隔不同色调级别的点。而Palette用于不同层次的hue变量。
句法:
seaborn.stripplot(x, y, data, hue, palette, dodge)
Python3
# Python program to illustrate
# swarmplot using inbuilt data-set
# given in seaborn

# importing the required module
import seaborn

# use to set style of background of plot
seaborn.set(style="whitegrid")

# loading data-set
tips = seaborn.load_dataset("tips")

seaborn.swarmplot(x="day", y="total_bill", hue="smoker",
                   data=tips, palette="Set2", dodge=True)
输出:
Possible values of palette are:
Accent, Accent_r, Blues, Blues_r, BrBG, BrBG_r, BuGn, BuGn_r, BuPu, BuPu_r, CMRmap, CMRmap_r, Dark2, Dark2_r,
GnBu, GnBu_r, Greens, Greens_r, Greys, Greys_r, OrRd, OrRd_r, Oranges, Oranges_r, PRGn, PRGn_r, Paired, Paired_r,
Pastel1, Pastel1_r, Pastel2, Pastel2_r, PiYG, PiYG_r, PuBu, PuBuGn, PuBuGn_r, PuBu_r, PuOr, PuOr_r, PuRd, PuRd_r,
Purples, Purples_r, RdBu, RdBu_r, RdGy, RdGy_r, RdPu, RdPu_r, RdYlBu, RdYlBu_r, RdYlGn, RdYlGn_r, Reds, Reds_r, Set1,
Set1_r, Set2, Set2_r, Set3, Set3_r, Spectral, Spectral_r, Wistia, Wistia_r, YlGn, YlGnBu, YlGnBu_r, YlGn_r, YlOrBr,
YlOrBr_r, YlOrRd, YlOrRd_r, afmhot, afmhot_r, autumn, autumn_r, binary, binary_r, bone, bone_r, brg, brg_r, bwr, bwr_r,
cividis, cividis_r, cool, cool_r, coolwarm, coolwarm_r, copper, copper_r, cubehelix, cubehelix_r, flag, flag_r, gist_earth,
gist_earth_r, gist_gray, gist_gray_r, gist_heat, gist_heat_r, gist_ncar, gist_ncar_r, gist_rainbow, gist_rainbow_r, gist_stern,
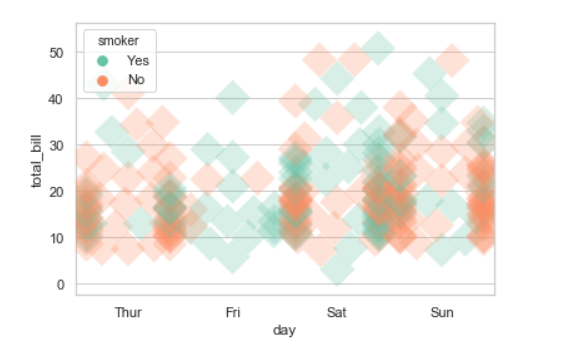
6. 用marker和alpha参数绘制大点和不同的美学:
我们将使用 alpha 来管理数据点的透明度,并使用 marker for marker 来自定义数据点。
Python3
# Python program to illustrate
# swarmplot using inbuilt data-set
# given in seaborn

# importing the required module
import seaborn

# use to set style of background of plot
seaborn.set(style="whitegrid")

# loading data-set
tips = seaborn.load_dataset("tips")

seaborn.swarmplot(x="day", y="total_bill", hue="smoker",
                   data=tips, palette="Set2", size=20, marker="D",
                   edgecolor="gray", alpha=.25)
输出:
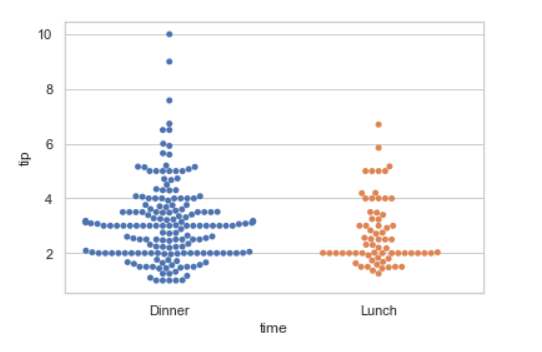
7. 通过传递显式命令来控制群体顺序:
Python3
# Python program to illustrate
# swarmplot using inbuilt data-set
# given in seaborn

# importing the required module
import seaborn

# use to set style of background of plot
seaborn.set(style="whitegrid")

# loading data-set
tips = seaborn.load_dataset("tips")

seaborn.swarmplot(x="time", y="tip", data=tips,
                   order=["Dinner", "Lunch"])
输出:
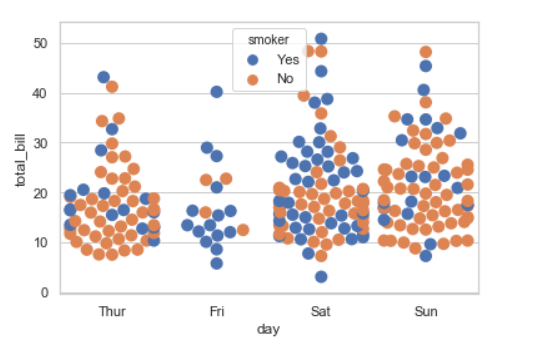
8.添加尺寸属性。
使用大小我们可以生成点,我们可以生成不同大小的点。
句法:
seaborn.swramplot( x, y, data, size)
Python3
# Python program to illustrate
# swarmplot using inbuilt data-set
# given in seaborn

# importing the required module
import seaborn

# use to set style of background of plot
seaborn.set(style="whitegrid")

# loading data-set
tips = seaborn.load_dataset("tips")

seaborn.swarmplot(x='day', y='total_bill', data=tips,
                  hue='smoker', size=10)
输出:
9.添加调色板属性:
使用调色板,我们可以生成具有不同颜色的点。在下面的示例中,我们可以看到调色板可以负责生成具有不同颜色图值的 swramplot。
Syntax:
seaborn.swramplot( x, y, data, palette=”color_name”)
Python3
# Python program to illustrate
# swarmplot using inbuilt data-set
# given in seaborn

# importing the required module
import seaborn

# use to set style of background of plot
seaborn.set(style="whitegrid")

# loading data-set
tips = seaborn.load_dataset("tips")

seaborn.swarmplot(x='day', y='total_bill', data=tips,
                  hue='time', palette='pastel')
输出: