Matplotlib 中的 Pyplot
Matplotlib是一个绘图库,用于在Python中创建静态、动画和交互式可视化。 Matplotlib 可用于Python脚本、 Python和 IPython shell、Web 应用程序服务器以及各种图形用户界面工具包,如 Tkinter、awxPython 等。
注意:有关更多信息,请参阅Python Matplotlib - 概述
安装
要使用 Pyplot,我们必须首先下载 matplotlib 模块。最好的方法是——
pip install matplotlibpyplot
Pyplot是一个 Matplotlib 模块,它提供了一个类似 MATLAB 的接口。 Matplotlib 旨在与 MATLAB 一样可用,具有使用Python的能力以及免费和开源的优势。每个 pyplot函数都会对图形进行一些更改:例如,创建图形,在图形中创建绘图区域,在绘图区域中绘制一些线条,用标签装饰绘图等。我们可以使用 Pyplot 使用的各种绘图是Line绘图、直方图、散点图、 3D 绘图、图像、等高线和极坐标。
句法 :
matplotlib.pyplot.plot(*args, scalex=True, scaley=True, data=None, **kwargs)
使用 pyplot 创建图形和可视化既快速又简单——
# Python program to show plot function

import matplotlib.pyplot as plt

plt.plot([1, 2, 3, 4], [1, 4, 9, 16])
plt.axis([0, 6, 0, 20])
plt.show()
输出 : 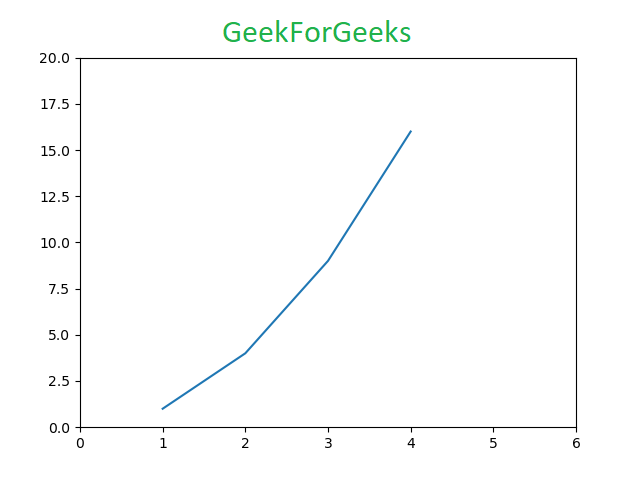
plot函数在具有指定比例的线性图中标记 x 坐标 (1, 2, 3, 4) 和 y 坐标 (1, 4, 9, 16)。 [/标题]
参数:此函数接受使我们能够设置坐标轴比例和格式化图形的参数。这些参数如下所述:-
- plot(x, y):使用默认线型和颜色绘制 x 和 y。
- plot.axis([xmin, xmax, ymin, ymax]) :将 x 轴和 y 轴从最小值缩放到最大值
- plot.(x, y, color='green', marker='o', linestyle='dashed', linewidth=2, markersize=12): x 和 y 坐标使用大小为 12 和绿色的圆形标记进行标记color line with — 宽度为 2 的样式
- plot.xlabel('X-axis') : 命名 x 轴
- plot.ylabel('Y-axis') : 命名 y 轴
- plot(x, y, label = 'Sample line ')绘制的 Sample Line 将显示为图例
例如,我们将使用印度和孟加拉国的电力消耗数据集。在这里,我们使用 Google Public Data 作为数据源。
示例 1:线性图
# Python Program to illustrate Linear Plotting

import matplotlib.pyplot as plt

# year contains the x-axis values
# and e-india & e-bangladesh
# are the y-axis values for plotting

year = [1972, 1982, 1992, 2002, 2012]
e_india = [100.6, 158.61, 305.54, 394.96, 724.79]
e_bangladesh = [10.5, 25.21, 58.65, 119.27, 274.87]

# plotting of x-axis(year) and
# y-axis(power consumption)
with different colored labels of two countries

plt.plot(year, e_india, color ='orange',
         label ='India')

plt.plot(year, e_bangladesh, color ='g',
         label ='Bangladesh')

# naming of x-axis and y-axis
plt.xlabel('Years')
plt.ylabel('Power consumption in kWh')

# naming the title of the plot
plt.title('Electricity consumption per capita\
 of India and Bangladesh')

plt.legend()
plt.show()
输出 :

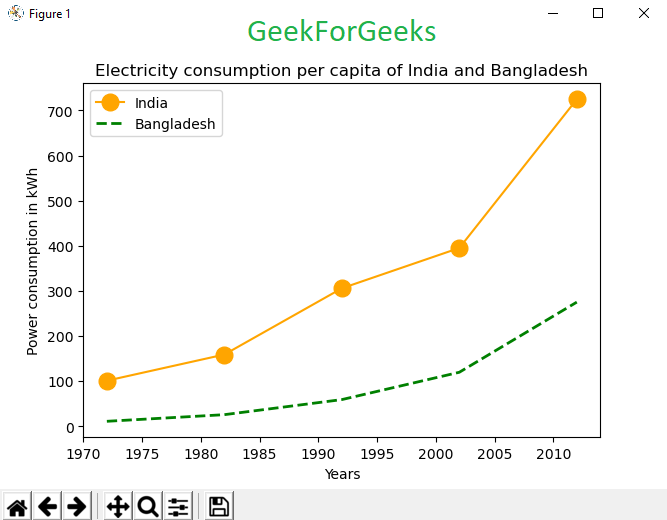
示例 2:带有线条格式的线性图
# Python Program to illustrate Linear Plotting

import matplotlib.pyplot as plt

year = [1972, 1982, 1992, 2002, 2012]
e_india = [100.6, 158.61, 305.54,
           394.96, 724.79]

e_bangladesh = [10.5, 25.21, 58.65,
                119.27, 274.87]

# formatting of line style and
# plotting of co-ordinates
plt.plot(year, e_india, color ='orange',
         marker ='o', markersize = 12,
         label ='India')

plt.plot(year, e_bangladesh, color ='g',
         linestyle ='dashed', linewidth = 2,
         label ='Bangladesh')


plt.xlabel('Years')
plt.ylabel('Power consumption in kWh')


plt.title('Electricity consumption per \
capita of India and Bangladesh')

plt.legend()
plt.show()
输出 :