聚类是将一组对象(列中的所有值)分组的任务,使同一组中的对象彼此之间比其他组中的对象更相似。 K-means 聚类是最简单和流行的无监督机器学习算法之一。
无监督算法仅使用输入向量从数据集进行推断,而不参考已知或标记的结果。
定义一个目标数k,它指的是你在数据集中需要的质心数。质心是代表集群中心的假想或真实位置。
通过减少簇内平方和将每个数据点分配给每个簇。 K-means 算法识别 k 个质心,然后将每个数据点分配到最近的集群,同时保持质心尽可能小。
Note: Means in k-means refers to averaging of the data.
它是如何在 Julia 中实现的?
在 Julia 中,可以借助一些算法来实现。 K均值就是这样一种算法。这可以借助kmeans()等内置函数轻松实现。
该函数将数据划分为具有相似特征的簇: 数据,没有。我们需要的集群数量, iter:关键字,如果我们想知道创建集群需要多少次迭代 在此函数作为参数传递。
涉及的包裹:
- 数据框
- 聚类
- 地块
- 数据集
RDatasets 包提供对 R 中可用的许多经典数据集的访问。
Julia
# syntax for loading the packages
using Pkg

# to create dataframes and load
Pkg.add("DataFrames")
using DataFrames

# to use the above function kmeans()
Pkg.add("Clustering")
using Clustering

# to visualise our clusters formed
Pkg.add("Plots")
using Plots

# RDatasets to load the already made datasets
Pkg.add("RDatasets")
using RDatasets
Julia
# loading the data and storing it in iris dataframe
iris = dataset("datasets", "iris");
Julia
# Fetching the each value of data
# using collect() function and
# storing in features
features = collect(Matrix(iris[:, 1:4])');
Julia
# running  K-means for the 4 clusters
result = kmeans(features, 4);
Julia
# plot with the point color mapped
# to the assigned cluster index
scatter(iris.PetalLength, iris.PetalWidth,
        marker_z = result.assignments,
        color =:blue, legend = false)
Julia
# loading the data and storing it in iris dataframe
iris = dataset("datasets", "iris");

# Fetching the each value of data
# using collect() function and
# storing in features
features = collect(Matrix(iris[:, 1:4])');

# running  K-means for the 4 clusters
result = kmeans(features, 4);

# plot with the point color mapped
# to the assigned cluster index
scatter(iris.PetalLength, iris.PetalWidth,
        marker_z = result.assignments,
        color =:blue, legend = false)
Julia
# make a random dataset with
# 1000 random 5-dimensional points
X = rand(5, 1000)
Julia
# cluster X into 20 clusters using K-means
R = kmeans(X, 15; maxiter = 200,
                  display=:iter)
Julia
# verify the number of clusters
nclusters(R) == 15
Julia
# get the assignments of points to clusters
a = assignments(R)
Julia
# get the cluster sizes
c = counts(R)
Julia
# get the cluster centers
M = R.centers
Julia
# make a random dataset with
# 1000 random 5-dimensional points
X = rand(5, 1000)

# cluster X into 20 clusters using K-means
R = kmeans(X, 15; maxiter = 200, display=:iter)

# verify the number of clusters
nclusters(R) == 15

# get the assignments of points to clusters
# a = assignments(R)

# get the cluster sizes
# c = counts(R)

# get the cluster centers
M = R.centers
涉及的功能:
- dataset():我们可以使用这个函数访问Fisher的虹膜数据集,并将参数作为“数据集”和“虹膜”传递。
- Matrix():构造一个大小为 m×n 的未初始化的 Matrix{T}。
- collect():它返回指定集合或迭代器中所有项目的数组。
- scatter():用于返回数据集的散点图。
- rand():从指定的值和维度集合中选择一个随机元素或随机元素数组,并且没有数字作为参数传递。
- nclusters(R):此函数用于将形成的簇数与我们在kmeans()函数传递的簇数相匹配,此处R 表示从kmeans()返回的簇的结果。
现有数据集中的聚类
以下是在现有数据集中执行聚类所涉及的步骤:
步骤 1:在dataset()函数,将数据集和iris作为参数传递并将数据存储在数据帧iris 中。
朱莉娅
# loading the data and storing it in iris dataframe
iris = dataset("datasets", "iris");
第 2 步:现在将数据存储在数据帧中后,我们需要创建一个2D 矩阵,可以借助Matrix()函数来实现。
第 3 步:现在将矩阵存储在特征数据帧中,该数据帧表示在collect()函数的帮助下形成所获取数组的集群所需的总行和列。
朱莉娅
# Fetching the each value of data
# using collect() function and
# storing in features
features = collect(Matrix(iris[:, 1:4])');
第 4 步:现在应用函数kmeans()并传递特征和no。簇作为参数。
朱莉娅
# running  K-means for the 4 clusters
result = kmeans(features, 4);
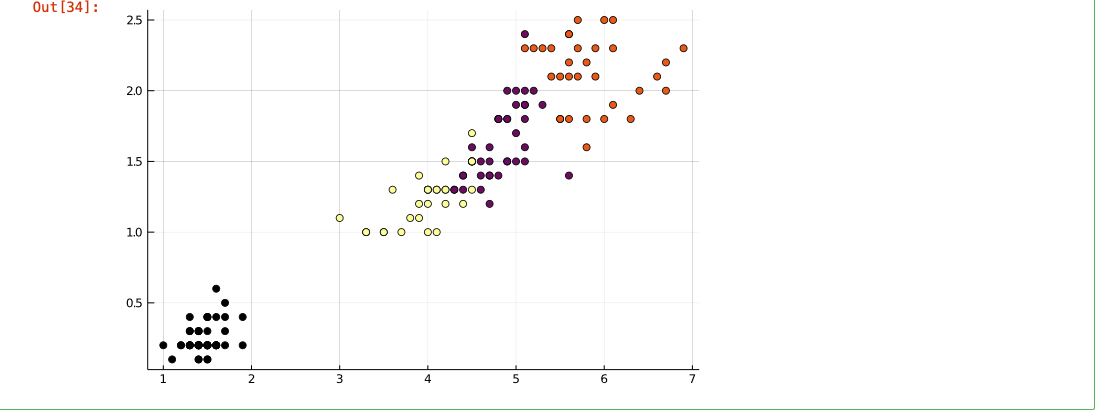
第 5 步:在scatter()函数的帮助下绘制集群,以获得 4 个不同颜色的集群的散点图。
朱莉娅
# plot with the point color mapped
# to the assigned cluster index
scatter(iris.PetalLength, iris.PetalWidth,
        marker_z = result.assignments,
        color =:blue, legend = false)
最终代码:
朱莉娅
# loading the data and storing it in iris dataframe
iris = dataset("datasets", "iris");

# Fetching the each value of data
# using collect() function and
# storing in features
features = collect(Matrix(iris[:, 1:4])');

# running  K-means for the 4 clusters
result = kmeans(features, 4);

# plot with the point color mapped
# to the assigned cluster index
scatter(iris.PetalLength, iris.PetalWidth,
        marker_z = result.assignments,
        color =:blue, legend = false)
输出:
创建数据集后的聚类
以下是在创建数据集后执行聚类所涉及的步骤:
第 1 步:使用rand()函数形成具有随机数的数据集并将其存储到数据框中,同时传递随机数所需的维度。
朱莉娅
# make a random dataset with
# 1000 random 5-dimensional points
X = rand(5, 1000)
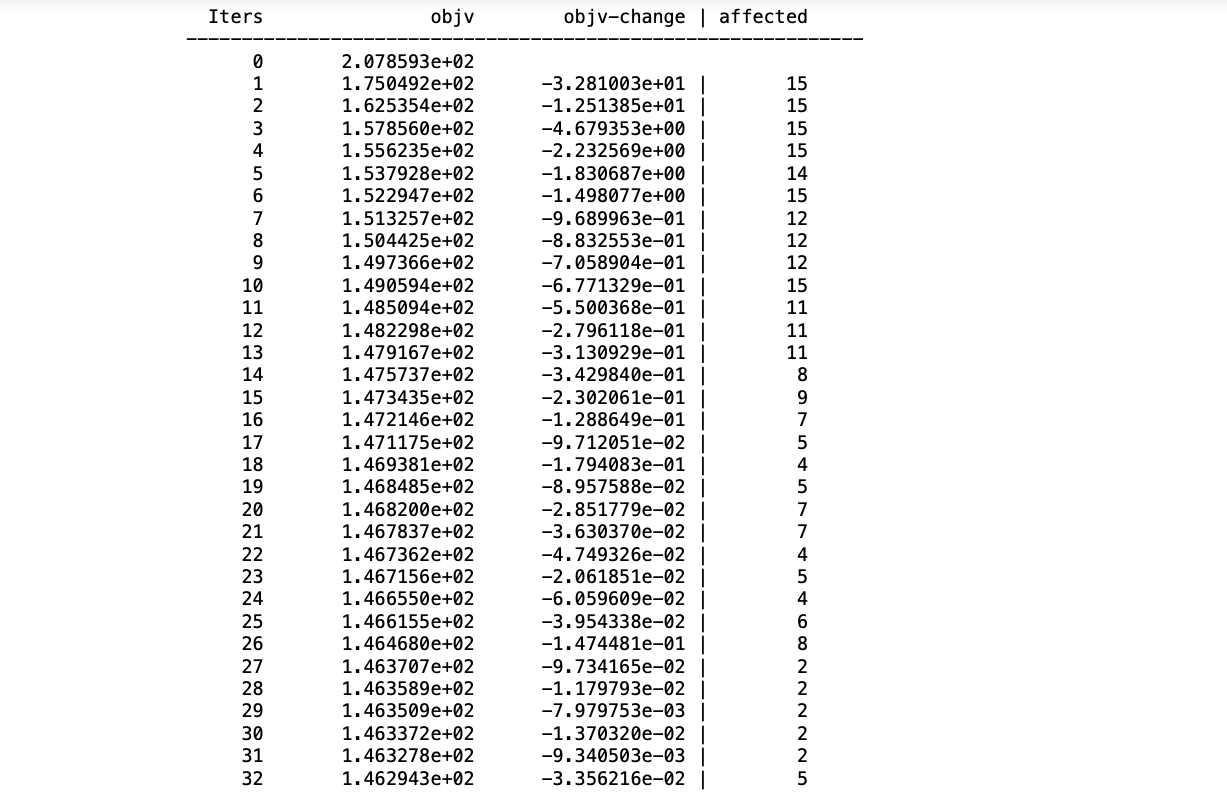
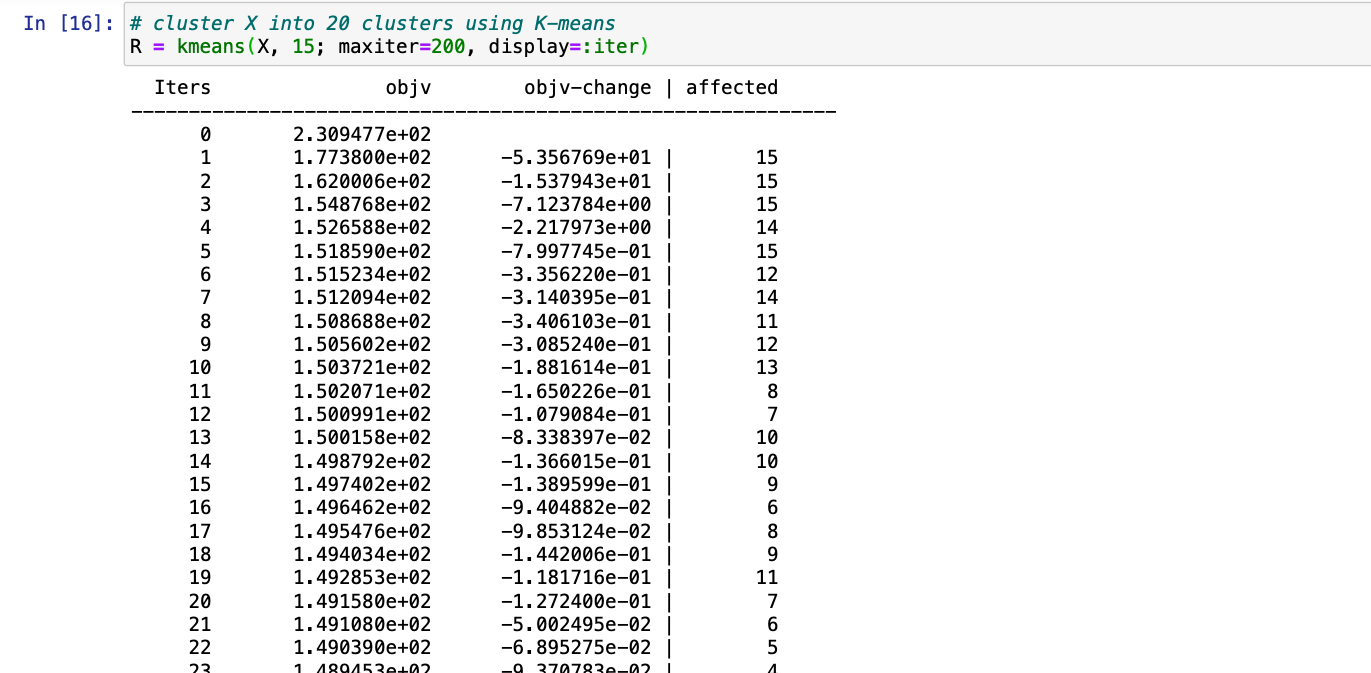
第 2 步:现在只需应用kmeans()函数并传递随机数数据帧,通过参数display=:iter 显示迭代,我们还需要传递此函数允许执行的maxiter最大迭代的值。
朱莉娅
# cluster X into 20 clusters using K-means
R = kmeans(X, 15; maxiter = 200,
                  display=:iter)
步骤3:通过使k均值的结果确认具有nclusters()函数形成的群集的数量()作为 一个参数,我们将得到布尔值true或false。
朱莉娅
# verify the number of clusters
nclusters(R) == 15

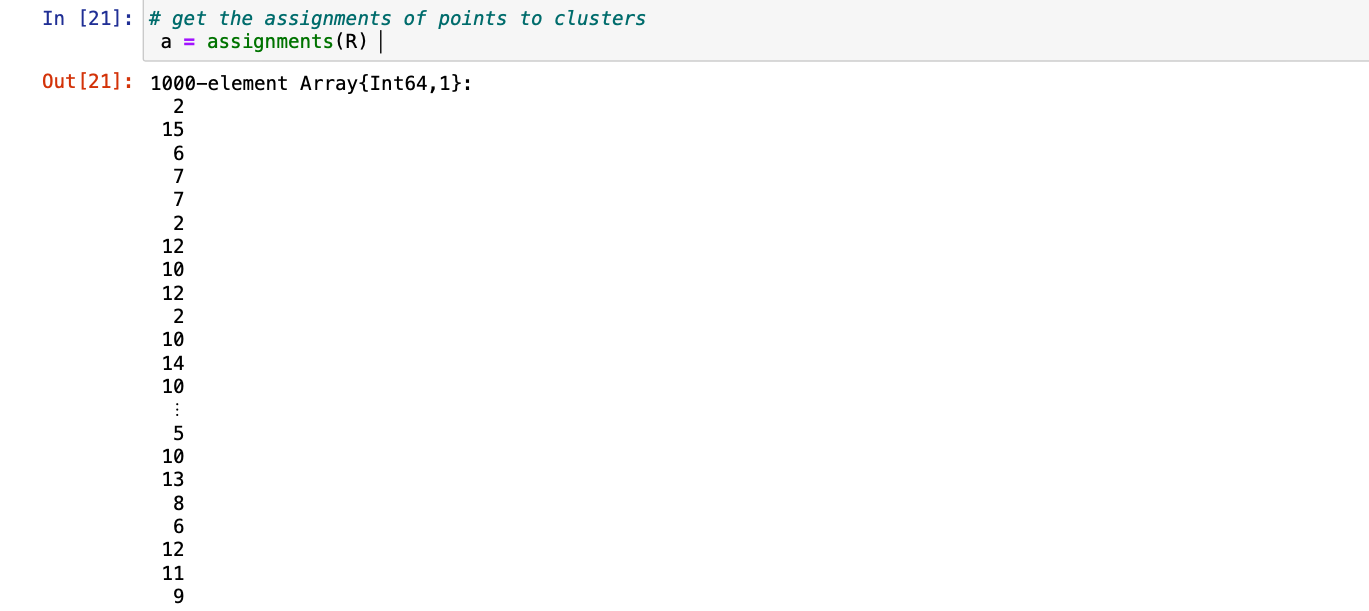
第 4 步:我们现在可以借助assignments()函数并传递从kmeans()返回的簇 ( R)来将分配的点分配给簇。
朱莉娅
# get the assignments of points to clusters
a = assignments(R)
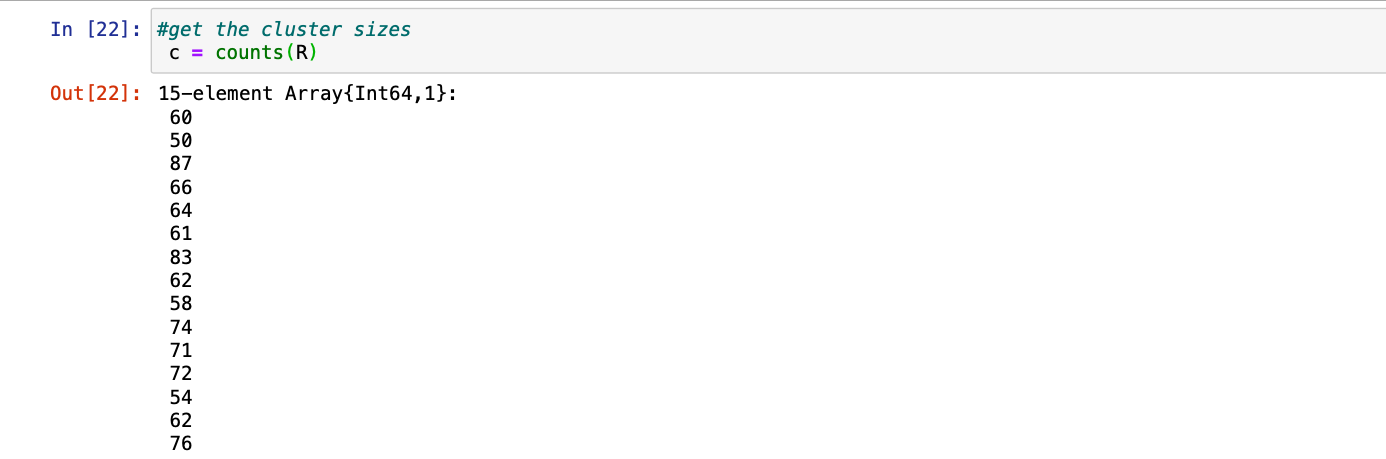
第 5 步:我们还可以借助简单的函数counts(R)获得簇的大小
朱莉娅
# get the cluster sizes
c = counts(R)
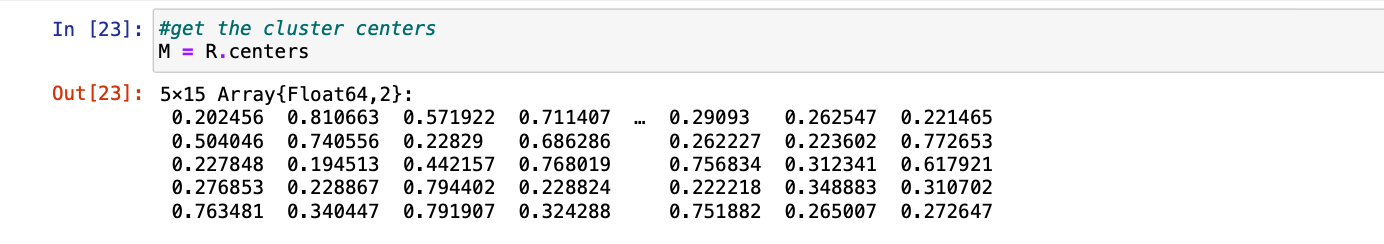
步骤6:最后我们可以得到以R为对象的聚类中心的值并访问 中心。
朱莉娅
# get the cluster centers
M = R.centers
最终代码:
朱莉娅
# make a random dataset with
# 1000 random 5-dimensional points
X = rand(5, 1000)

# cluster X into 20 clusters using K-means
R = kmeans(X, 15; maxiter = 200, display=:iter)

# verify the number of clusters
nclusters(R) == 15

# get the assignments of points to clusters
# a = assignments(R)

# get the cluster sizes
# c = counts(R)

# get the cluster centers
M = R.centers
输出: