使用 XlsxWriter 模块 – Python
XlsxWriter是一个Python模块,它提供了使用Python处理 Excel 的各种方法。它可用于读取、写入、应用公式。此外,它还支持格式、图像、图表、页面设置、自动过滤器、条件格式等功能。
本教程旨在提供有关 XlsxWriter 模块的知识,从基础知识到帮助解释清楚的示例和概念。
安装
在深入了解模块之前,让我们从安装它开始。要安装它,请在终端中键入以下命令。
pip install XlsxWriter
您应该会看到成功安装的消息。现在安装后让我们深入了解模块。
创建和写入 Excel
安装完成后,我们先写一个简单的代码,然后我们就会理解代码。
例子:
Python3
# import xlsxwriter module
import xlsxwriter

# Workbook() takes one, non-optional, argument
# which is the filename that we want to create.
workbook = xlsxwriter.Workbook('sample.xlsx')

# The workbook object is then used to add new
# worksheet via the add_worksheet() method.
worksheet = workbook.add_worksheet()

# Use the worksheet object to write
# data via the write() method.
worksheet.write('A1', 'Hello..')
worksheet.write('B1', 'Geeks')
worksheet.write('C1', 'For')
worksheet.write('D1', 'Geeks')

# Finally, close the Excel file
# via the close() method.
workbook.close()
Python3
# import xlsxwriter module
import xlsxwriter

workbook = xlsxwriter.Workbook('sample.xlsx')
worksheet = workbook.add_worksheet()

# Start from the first cell.
# Rows and columns are zero indexed.
row = 0
column = 0

content = ["Welcome", "to", "Geeks", "for", "Geeks"]

# iterating through content list
for item in content :

    # write operation perform
    worksheet.write(row, column, item)

    # incrementing the value of row by one
    # with each iterations.
    row += 1

workbook.close()
Python3
# import xlsxwriter module
import xlsxwriter

workbook = xlsxwriter.Workbook('sample.xlsx')
worksheet = workbook.add_worksheet()

content = ["Welcome", "to", "Geeks", "for", "Geeks"]

# Writing to row and column respectively
worksheet.write_row(0, 1, content)
worksheet.write_column(1, 0, content)

workbook.close()
Python3
# import xlsxwriter module
import xlsxwriter

workbook = xlsxwriter.Workbook('sample.xlsx')
worksheet = workbook.add_worksheet()

content = [1, 2]

# Writing to row and column respectively
worksheet.write_row(0, 1, content)
worksheet.write_column(1, 0, content)

# Using the array formula to find the
# sum and the product of the given cells
worksheet.write_formula('A4', '{=SUM(A2, A3)}')
worksheet.write_formula('D1', '{=PRODUCT(B1, C1)}')

workbook.close()
Python3
# import xlsxwriter module
import xlsxwriter

workbook = xlsxwriter.Workbook('sample.xlsx')
worksheet = workbook.add_worksheet()

content = [1, 2, 3, 4, 5]

# Writing to row and column respectively
worksheet.write_row(0, 1, content)
worksheet.write_column(1, 0, content)

# Using the array formula to find the
# sum and the product of the given cells
worksheet.write_array_formula('A7', '{=SUM(A1:A6)}')
worksheet.write_array_formula('G1', '{=PRODUCT(B1:F1)}')

workbook.close()
Python3
# import xlsxwriter module
import xlsxwriter

workbook = xlsxwriter.Workbook('sample.xlsx')
worksheet = workbook.add_worksheet()

content = [1, 2, 3, 5, 3, 2, 2]

# Writing to row and column respectively
worksheet.write_column(0, 0, content)

# Creating the chart object of type bar
chart = workbook.add_chart({'type': 'column'})

# Add a series to the chart
chart.add_series({'values': '=Sheet1!$A$1:$A$7'})

# Insert the chart into the worksheet
worksheet.insert_chart('C1', chart)

workbook.close()
Python3
# import xlsxwriter module
import xlsxwriter

workbook = xlsxwriter.Workbook('sample.xlsx')
worksheet = workbook.add_worksheet()

content = [1, 2, 3, 5, 3, 2, 2]

# Writing to row and column respectively
worksheet.write_column(0, 0, content)

# Creating the chart object of type bar
chart = workbook.add_chart({'type': 'line'})

# Add a series to the chart
chart.add_series({'values': '=Sheet1!$A$1:$A$7',
                 'marker': {'type': 'diamond'},})

# Insert the chart into the worksheet
worksheet.insert_chart('C1', chart)

workbook.close()
Python3
# import xlsxwriter module
import xlsxwriter

workbook = xlsxwriter.Workbook('sample.xlsx')
worksheet = workbook.add_worksheet()

# Data for the table
data = [
    [1, 2, 3],
    [4, 5, 6],
    [7, 8, 9],
    [10, 11, 12],

]

# Creating the Table
worksheet.add_table('B2:D5', {'data': data})

workbook.close()
Python3
# import pandas as pd
import pandas as pd

# Create a Pandas dataframe from some data.
df = pd.DataFrame({'Data': ['Geeks', 'For', 'geeks', 'is',
                            'portal', 'for', 'geeks']})

# Create a Pandas Excel writer
# object using XlsxWriter as the engine.
writer = pd.ExcelWriter('sample.xlsx',
                        engine='xlsxwriter')

# Write a dataframe to the worksheet.
df.to_excel(writer, sheet_name='Sheet1')

# Close the Pandas Excel writer
# object and output the Excel file.
writer.save()
Python3
# import pandas as pd
import pandas as pd


# Create some Pandas dataframes from some data.
df1 = pd.DataFrame({'Data': [11, 12, 13, 14]})
df2 = pd.DataFrame({'Data': [21, 22, 23, 24]})
df3 = pd.DataFrame({'Data': [31, 32, 33, 34]})
df4 = pd.DataFrame({'Data': [41, 42, 43, 44]})

# Create a Pandas Excel writer object
# using XlsxWriter as the engine.
writer = pd.ExcelWriter('sample.xlsx',
                        engine='xlsxwriter')

# write and Positioning the dataframes in the worksheet.
# Default position, cell A1.
df1.to_excel(writer, sheet_name='Sheet1')
df2.to_excel(writer, sheet_name='Sheet1', startcol=3)
df3.to_excel(writer, sheet_name='Sheet1', startrow=6)

# It is also possible to write the
# dataframe without the header and index.
df4.to_excel(writer, sheet_name='Sheet1',
             startrow=7, startcol=4,
             header=False, index=False)

# Close the Pandas Excel writer object
# and output the Excel file.
writer.save()
Python3
# import pandas library as pd
import pandas as pd

# from datetime module import
# datetime and date method
from datetime import datetime, date

# Create a Pandas dataframe from some datetime data.
# datetime(year,month,date,hour,minute,second)
# date(year,month,date)
dataframe = pd.DataFrame({
    'Date and time': [datetime(2018, 1, 11, 11, 30, 55),
                      datetime(2018, 2, 12, 1, 20, 33),
                      datetime(2018, 3, 13, 11, 10),
                      datetime(2018, 4, 14, 16, 45, 35),
                      datetime(2018, 5, 15, 12, 10, 15)],

    'Dates only': [date(2018, 6, 21),
                   date(2018, 7, 22),
                   date(2018, 8, 23),
                   date(2018, 9, 24),
                   date(2018, 10, 25)], })

# Create a Pandas Excel writer
# object using XlsxWriter as the engine.
# Also set the default datetime and date formats.

# mmmm dd yyyy => month date year
# month - full name, date - 2 digit, year - 4 digit

# mmm d yyyy hh:mm:ss => month date year hour: minute: second
# month - first 3 letters , date - 1 or 2 digit , year - 4 digit.
writer_object = pd.ExcelWriter("sample.xlsx",
                               engine='xlsxwriter',
                               datetime_format='mmm d yyyy hh:mm:ss',
                               date_format='mmmm dd yyyy')

# Write a dataframe to the worksheet.
dataframe.to_excel(writer_object, sheet_name='Sheet1')

# Create xlsxwriter worksheet object
worksheet_object = writer_object.sheets['Sheet1']

# set width of the B and C column
worksheet_object.set_column('B:C', 20)

# Close the Pandas Excel writer
# object and output the Excel file.
writer_object.save()
Python3
# import pandas lib as pd
import pandas as pd


data1 = ["Math", "Physics", "Computer",
         "Hindi", "English", "chemistry"]

data2 = [95, 78, 80, 80, 60, 95]
data3 = [90, 67, 78, 70, 63, 90]

# Create a Pandas dataframe from some data.
dataframe = pd.DataFrame(
    {'Subject': data1,
     'Mid Term Exam Scores Out of 100': data2,
     'End Term Exam Scores Out of 100': data3})

# Create a Pandas Excel writer
# object using XlsxWriter as the engine.
writer_object = pd.ExcelWriter("sample.xlsx",
                               engine='xlsxwriter')

# Write a dataframe to the worksheet.
# we turn off the default header
# and skip one row because we want
# to insert a user defined header there.
dataframe.to_excel(writer_object, sheet_name='Sheet1',
                   startrow=1, header=False)

# Create xlsxwriter workbook object .
workbook_object = writer_object.book

# Create xlsxwriter worksheet object
worksheet_object = writer_object.sheets['Sheet1']

# Create a new Format object to formats cells
# in worksheets using add_format() method .

# here we create a format object for header.
header_format_object = workbook_object.add_format({
    'bold': True,
    'italic': True,
    'text_wrap': True,
    'valign': 'top',
    'font_color': 'green',
    'border': 2})

# Write the column headers with the defined format.
for col_number, value in enumerate(dataframe.columns.values):
    worksheet_object.write(0, col_number + 1, value,
                           header_format_object)

# Close the Pandas Excel writer
# object and output the Excel file.
writer_object.save()
Python3
# import pandas library as pd
import pandas as pd

# Create a Pandas dataframe from some data.
dataframe = pd.DataFrame({
    'Subject': ["Math", "Physics", "Computer",
                "Hindi", "English", "chemistry"],
    'Mid Exam Score': [90, 78, 60, 80, 60, 90],
    'End Exam Score': [45, 39, 30, 40, 30, 60]})

# Create a Pandas Excel writer
# object using XlsxWriter as the engine.
writer_object = pd.ExcelWriter('sample.xlsx',
                               engine='xlsxwriter')

# Write a dataframe to the worksheet.
dataframe.to_excel(writer_object, sheet_name='Sheet1')

# Create xlsxwriter workbook object .
workbook_object = writer_object.book

# Create xlsxwriter worksheet object
worksheet_object = writer_object.sheets['Sheet1']

# set width of the B and C column
worksheet_object.set_column('B:C', 20)

# Create a chart object that can be added
# to a worksheet using add_chart() method.

# here we create a column chart object .
chart_object = workbook_object.add_chart({'type': 'column'})

# Add a data series to a chart
# using add_series method.

# Configure the first series.
# syntax to define ranges is :
# [sheetname, first_row, first_col, last_row, last_col].
chart_object.add_series({
    'name':     ['Sheet1', 0, 2],
    'categories': ['Sheet1', 1, 3, 6, 3],
    'values':     ['Sheet1', 1, 2, 6, 2],
})

# Configure a second series.
chart_object.add_series({
    'name':     ['Sheet1', 0, 1],
    'categories': ['Sheet1', 1, 3, 6, 3],
    'values':     ['Sheet1', 1, 1, 6, 1],
})

# Add a chart title.
chart_object.set_title({'name': 'Exam Score Distribution'})

# Add x-axis label
chart_object.set_x_axis({'name': 'Subjects'})

# Add y-axis label
chart_object.set_y_axis({'name': 'Marks'})

# add chart to the worksheet with given
# offset values at the top-left corner of
# a chart is anchored to cell E2
worksheet_object.insert_chart('B10', chart_object,
                              {'x_offset': 20, 'y_offset': 5})

# Close the Pandas Excel writer
# object and output the Excel file.
writer_object.save()
输出:
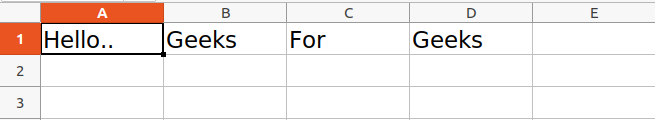
在上面的示例中,我们调用了用于创建空工作簿的函数Workbook() 。将创建名为 sample.xlsx 的 Excel 文件。然后使用add_worksheet()方法将电子表格添加到工作簿中,并将该电子表格保存在对象名称工作表下。然后使用write()方法将数据写入电子表格。第一个参数用于传递单元格名称。单元格名称也可以通过索引名称传递如A1被索引为(0, 0),B1为(0, 1),A2为(1, 0),B2为(1, 1)。
注意: XlsxWriter 中的行和列是零索引的。
现在让我们看看如何将数据添加到特定的行或列。请参阅以下示例。
例子:
蟒蛇3
# import xlsxwriter module
import xlsxwriter

workbook = xlsxwriter.Workbook('sample.xlsx')
worksheet = workbook.add_worksheet()

# Start from the first cell.
# Rows and columns are zero indexed.
row = 0
column = 0

content = ["Welcome", "to", "Geeks", "for", "Geeks"]

# iterating through content list
for item in content :

    # write operation perform
    worksheet.write(row, column, item)

    # incrementing the value of row by one
    # with each iterations.
    row += 1

workbook.close()
输出:
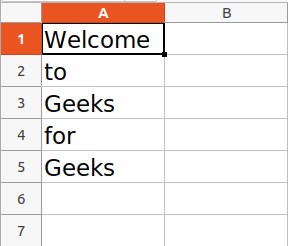
您可能已经看到我们正在使用索引号来写入特定行。同样,我们可以使用类似的方式写入特定列。
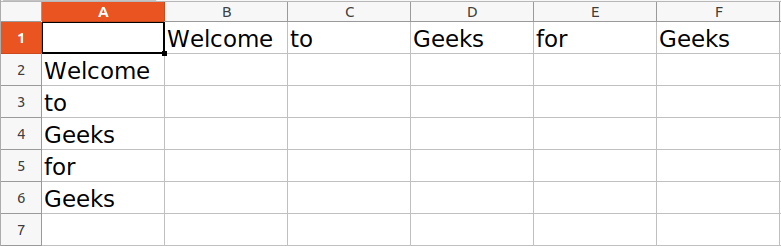
XlsxWriter 模块还提供了write_row()和write_column()方法来写入特定的行或列。
例子:
蟒蛇3
# import xlsxwriter module
import xlsxwriter

workbook = xlsxwriter.Workbook('sample.xlsx')
worksheet = workbook.add_worksheet()

content = ["Welcome", "to", "Geeks", "for", "Geeks"]

# Writing to row and column respectively
worksheet.write_row(0, 1, content)
worksheet.write_column(1, 0, content)

workbook.close()
输出:
请参阅以下文章以获取有关使用 XlsxWriter 模块写入 Excel 的详细信息。
- 使用 xlsxwriter 模块创建和写入 Excel 文件
使用公式
XlsxWriter 模块提供了write_formula()和write_array_formula()方法来直接在 Excel 中编写公式。
- write_formula()方法用于将公式直接写入工作表单元格
- write_array_formula()方法用于将数组公式写入工作表单元格。 Excel 中的数组公式是对一组值执行的公式。
句法:
write_formula(row, col, formula[, cell_format[, value]])
write_array_formula(first_row, first_col, last_row, last_col, formula[, cell_format[, value]])
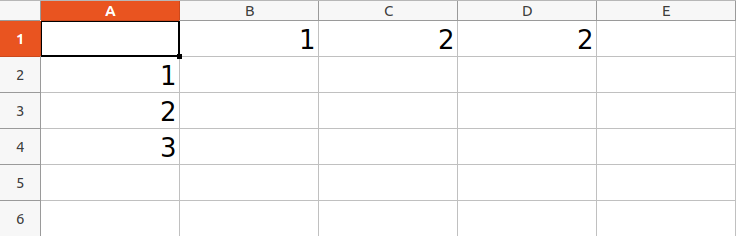
示例 1:使用 write_formula() 方法
蟒蛇3
# import xlsxwriter module
import xlsxwriter

workbook = xlsxwriter.Workbook('sample.xlsx')
worksheet = workbook.add_worksheet()

content = [1, 2]

# Writing to row and column respectively
worksheet.write_row(0, 1, content)
worksheet.write_column(1, 0, content)

# Using the array formula to find the
# sum and the product of the given cells
worksheet.write_formula('A4', '{=SUM(A2, A3)}')
worksheet.write_formula('D1', '{=PRODUCT(B1, C1)}')

workbook.close()
输出:
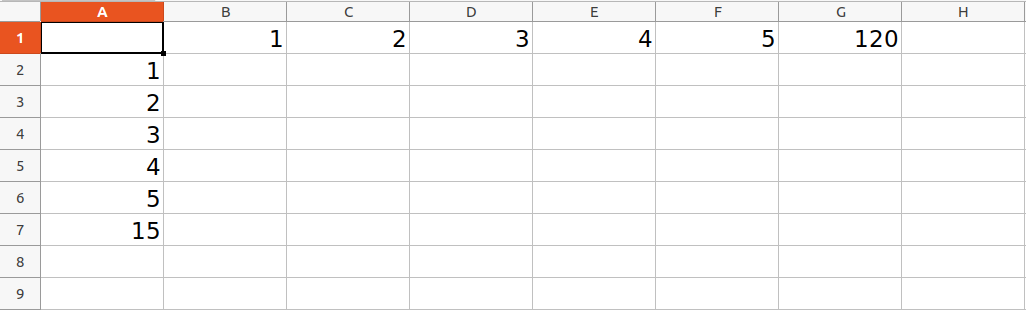
示例 2:使用 write_array_formula() 方法
蟒蛇3
# import xlsxwriter module
import xlsxwriter

workbook = xlsxwriter.Workbook('sample.xlsx')
worksheet = workbook.add_worksheet()

content = [1, 2, 3, 4, 5]

# Writing to row and column respectively
worksheet.write_row(0, 1, content)
worksheet.write_column(1, 0, content)

# Using the array formula to find the
# sum and the product of the given cells
worksheet.write_array_formula('A7', '{=SUM(A1:A6)}')
worksheet.write_array_formula('G1', '{=PRODUCT(B1:F1)}')

workbook.close()
输出:
添加图表
XlsxWriter 提供了一个Chart类,作为实现图表的基类。图表对象是使用add_chart()方法创建的。此方法还指定图表的类型。创建图表后,图表将使用insert_chart()方法添加到指定的单元格中,或者可以使用set_chart()方法进行设置。
句法:
add_chart(options)
insert_chart(row, col, chart[, options])
set_chart(chart)
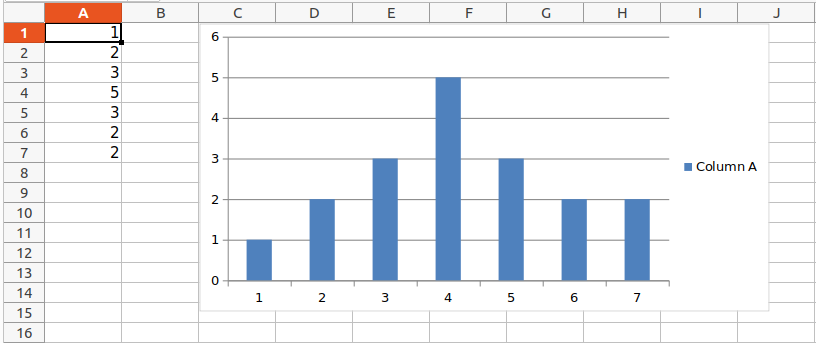
示例 1:
蟒蛇3
# import xlsxwriter module
import xlsxwriter

workbook = xlsxwriter.Workbook('sample.xlsx')
worksheet = workbook.add_worksheet()

content = [1, 2, 3, 5, 3, 2, 2]

# Writing to row and column respectively
worksheet.write_column(0, 0, content)

# Creating the chart object of type bar
chart = workbook.add_chart({'type': 'column'})

# Add a series to the chart
chart.add_series({'values': '=Sheet1!$A$1:$A$7'})

# Insert the chart into the worksheet
worksheet.insert_chart('C1', chart)

workbook.close()
输出:
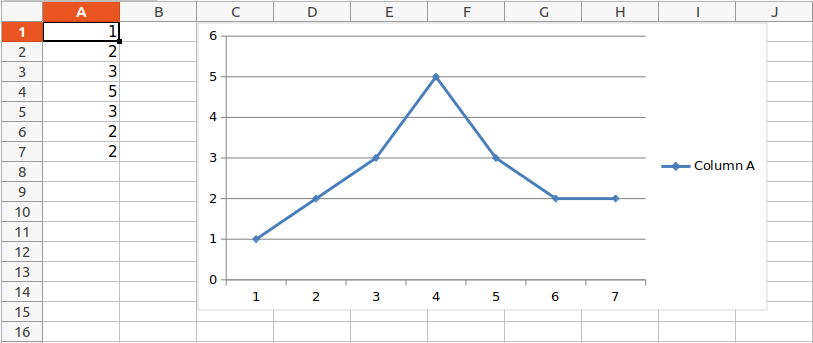
示例 2:添加带有菱形点的折线图
蟒蛇3
# import xlsxwriter module
import xlsxwriter

workbook = xlsxwriter.Workbook('sample.xlsx')
worksheet = workbook.add_worksheet()

content = [1, 2, 3, 5, 3, 2, 2]

# Writing to row and column respectively
worksheet.write_column(0, 0, content)

# Creating the chart object of type bar
chart = workbook.add_chart({'type': 'line'})

# Add a series to the chart
chart.add_series({'values': '=Sheet1!$A$1:$A$7',
                 'marker': {'type': 'diamond'},})

# Insert the chart into the worksheet
worksheet.insert_chart('C1', chart)

workbook.close()
输出:
请参阅以下文章以获取有关使用 XlsxWriter 模块绘制图表的详细信息。
- 使用 XlsxWriter 模块使用 Data Tools 在 Excel 表中绘制图表 |套装 – 1
- 使用 XlsxWriter 模块使用数据工具在 Excel 表格中绘制图表 |套装 – 2
- 使用 XlsxWriter 模块在 Excel 表格中绘制不同类型的样式图表
- 使用 XlsxWriter 模块在 Excel 表格中绘制折线图
- 使用 XlsxWriter 模块在 Excel 表格中绘制柱形图
- 使用 XlsxWriter 模块在 Excel 表格中绘制条形图
- 使用 XlsxWriter 模块在 Excel 表格中绘制散点图
- 使用 XlsxWriter 模块在 Excel 表格中绘制饼图
- 使用 XlsxWriter 模块在 Excel 表中绘制圆环图
- 使用 XlsxWriter 模块在 Excel 表中绘制面积图
- 使用 XlsxWriter 模块在 Excel 表格中绘制雷达图
- 使用 XlsxWriter 模块在 Excel 表格中绘制股票图表
- 使用 XlsxWriter 模块绘制带有渐变填充的 Excel 图表
- 使用 XlsxWriter 模块在 Excel 表中绘制组合图表
- 使用 XlsxWriter 模块在 Excel 工作表中添加图表表
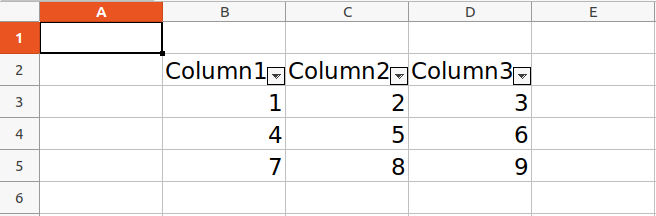
添加表格
可以使用add_table()方法添加表。表格的数据参数用于指定表格单元格的数据。 header_row参数用于关闭或打开表格的标题行。
句法:
add_table(first_row, first_col, last_row, last_col, options)
例子:
蟒蛇3
# import xlsxwriter module
import xlsxwriter

workbook = xlsxwriter.Workbook('sample.xlsx')
worksheet = workbook.add_worksheet()

# Data for the table
data = [
    [1, 2, 3],
    [4, 5, 6],
    [7, 8, 9],
    [10, 11, 12],

]

# Creating the Table
worksheet.add_table('B2:D5', {'data': data})

workbook.close()
输出:
使用 Pandas 和 XlsxWriter
Pandas使用 XlsxWriter ot Openpyxl 模块编写 Excel 文件。这可用于读取、过滤和重新排列小型或大型数据集,并以包括 Excel 在内的一系列格式输出它们。 pandas 库的ExcelWriter()方法使用 XlsxWriter 创建一个 Excel 编写器对象。然后使用to_excel()方法将数据框写入 excel。
示例 1:
蟒蛇3
# import pandas as pd
import pandas as pd
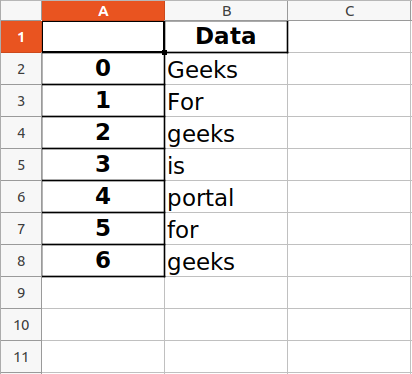
# Create a Pandas dataframe from some data.
df = pd.DataFrame({'Data': ['Geeks', 'For', 'geeks', 'is',
'portal', 'for', 'geeks']})
# Create a Pandas Excel writer
# object using XlsxWriter as the engine.
writer = pd.ExcelWriter('sample.xlsx',
engine='xlsxwriter')
# Write a dataframe to the worksheet.
df.to_excel(writer, sheet_name='Sheet1')
# Close the Pandas Excel writer
# object and output the Excel file.
writer.save()
输出:
示例 2:写入多个数据帧。
蟒蛇3
# import pandas as pd
import pandas as pd


# Create some Pandas dataframes from some data.
df1 = pd.DataFrame({'Data': [11, 12, 13, 14]})
df2 = pd.DataFrame({'Data': [21, 22, 23, 24]})
df3 = pd.DataFrame({'Data': [31, 32, 33, 34]})
df4 = pd.DataFrame({'Data': [41, 42, 43, 44]})

# Create a Pandas Excel writer object
# using XlsxWriter as the engine.
writer = pd.ExcelWriter('sample.xlsx',
                        engine='xlsxwriter')

# write and Positioning the dataframes in the worksheet.
# Default position, cell A1.
df1.to_excel(writer, sheet_name='Sheet1')
df2.to_excel(writer, sheet_name='Sheet1', startcol=3)
df3.to_excel(writer, sheet_name='Sheet1', startrow=6)

# It is also possible to write the
# dataframe without the header and index.
df4.to_excel(writer, sheet_name='Sheet1',
             startrow=7, startcol=4,
             header=False, index=False)

# Close the Pandas Excel writer object
# and output the Excel file.
writer.save()
输出:

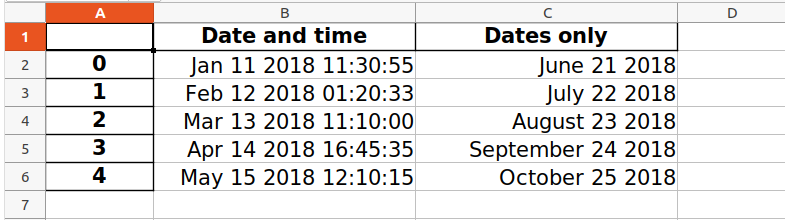
示例 3:使用 Pandas 和 XlsxWriter 将带有日期时间的 Pandas 数据框转换为带有默认日期时间和日期格式的 Excel 文件。
蟒蛇3
# import pandas library as pd
import pandas as pd

# from datetime module import
# datetime and date method
from datetime import datetime, date

# Create a Pandas dataframe from some datetime data.
# datetime(year,month,date,hour,minute,second)
# date(year,month,date)
dataframe = pd.DataFrame({
    'Date and time': [datetime(2018, 1, 11, 11, 30, 55),
                      datetime(2018, 2, 12, 1, 20, 33),
                      datetime(2018, 3, 13, 11, 10),
                      datetime(2018, 4, 14, 16, 45, 35),
                      datetime(2018, 5, 15, 12, 10, 15)],

    'Dates only': [date(2018, 6, 21),
                   date(2018, 7, 22),
                   date(2018, 8, 23),
                   date(2018, 9, 24),
                   date(2018, 10, 25)], })

# Create a Pandas Excel writer
# object using XlsxWriter as the engine.
# Also set the default datetime and date formats.

# mmmm dd yyyy => month date year
# month - full name, date - 2 digit, year - 4 digit

# mmm d yyyy hh:mm:ss => month date year hour: minute: second
# month - first 3 letters , date - 1 or 2 digit , year - 4 digit.
writer_object = pd.ExcelWriter("sample.xlsx",
                               engine='xlsxwriter',
                               datetime_format='mmm d yyyy hh:mm:ss',
                               date_format='mmmm dd yyyy')

# Write a dataframe to the worksheet.
dataframe.to_excel(writer_object, sheet_name='Sheet1')

# Create xlsxwriter worksheet object
worksheet_object = writer_object.sheets['Sheet1']

# set width of the B and C column
worksheet_object.set_column('B:C', 20)

# Close the Pandas Excel writer
# object and output the Excel file.
writer_object.save()
输出:
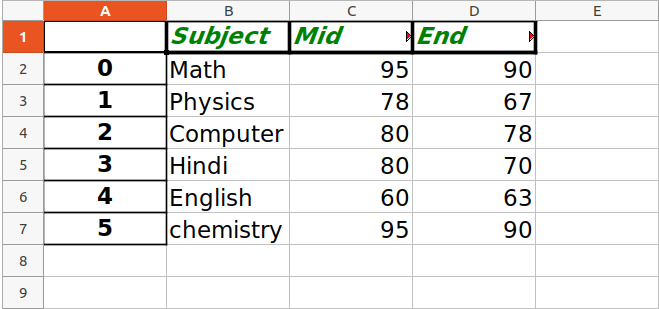
示例 4:使用 Pandas 和 XlsxWriter 将 Pandas 数据帧转换为具有用户定义标题格式的 Excel 文件。
蟒蛇3
# import pandas lib as pd
import pandas as pd


data1 = ["Math", "Physics", "Computer",
         "Hindi", "English", "chemistry"]

data2 = [95, 78, 80, 80, 60, 95]
data3 = [90, 67, 78, 70, 63, 90]

# Create a Pandas dataframe from some data.
dataframe = pd.DataFrame(
    {'Subject': data1,
     'Mid Term Exam Scores Out of 100': data2,
     'End Term Exam Scores Out of 100': data3})

# Create a Pandas Excel writer
# object using XlsxWriter as the engine.
writer_object = pd.ExcelWriter("sample.xlsx",
                               engine='xlsxwriter')

# Write a dataframe to the worksheet.
# we turn off the default header
# and skip one row because we want
# to insert a user defined header there.
dataframe.to_excel(writer_object, sheet_name='Sheet1',
                   startrow=1, header=False)

# Create xlsxwriter workbook object .
workbook_object = writer_object.book

# Create xlsxwriter worksheet object
worksheet_object = writer_object.sheets['Sheet1']

# Create a new Format object to formats cells
# in worksheets using add_format() method .

# here we create a format object for header.
header_format_object = workbook_object.add_format({
    'bold': True,
    'italic': True,
    'text_wrap': True,
    'valign': 'top',
    'font_color': 'green',
    'border': 2})

# Write the column headers with the defined format.
for col_number, value in enumerate(dataframe.columns.values):
    worksheet_object.write(0, col_number + 1, value,
                           header_format_object)

# Close the Pandas Excel writer
# object and output the Excel file.
writer_object.save()
输出:
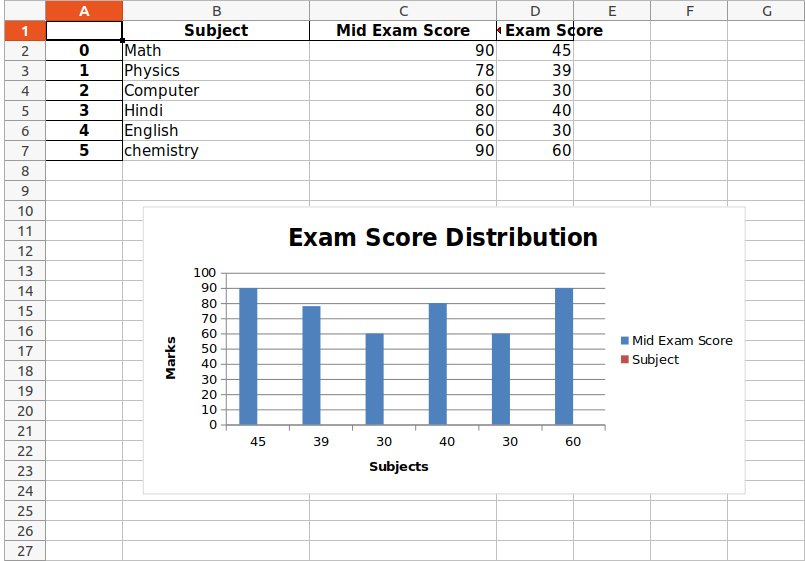
使用 Pandas 和 XlsxWriter 创建图表
到目前为止,我们已经看到了使用 Pandas 和 XlsxWriter 模块将数据添加到 Excel 文件的不同方法。现在,在插入数据后,我们可以使用上面看到的 add_chart() 方法简单地创建图表。
例子:
蟒蛇3
# import pandas library as pd
import pandas as pd

# Create a Pandas dataframe from some data.
dataframe = pd.DataFrame({
    'Subject': ["Math", "Physics", "Computer",
                "Hindi", "English", "chemistry"],
    'Mid Exam Score': [90, 78, 60, 80, 60, 90],
    'End Exam Score': [45, 39, 30, 40, 30, 60]})

# Create a Pandas Excel writer
# object using XlsxWriter as the engine.
writer_object = pd.ExcelWriter('sample.xlsx',
                               engine='xlsxwriter')

# Write a dataframe to the worksheet.
dataframe.to_excel(writer_object, sheet_name='Sheet1')

# Create xlsxwriter workbook object .
workbook_object = writer_object.book

# Create xlsxwriter worksheet object
worksheet_object = writer_object.sheets['Sheet1']

# set width of the B and C column
worksheet_object.set_column('B:C', 20)

# Create a chart object that can be added
# to a worksheet using add_chart() method.

# here we create a column chart object .
chart_object = workbook_object.add_chart({'type': 'column'})

# Add a data series to a chart
# using add_series method.

# Configure the first series.
# syntax to define ranges is :
# [sheetname, first_row, first_col, last_row, last_col].
chart_object.add_series({
    'name':     ['Sheet1', 0, 2],
    'categories': ['Sheet1', 1, 3, 6, 3],
    'values':     ['Sheet1', 1, 2, 6, 2],
})

# Configure a second series.
chart_object.add_series({
    'name':     ['Sheet1', 0, 1],
    'categories': ['Sheet1', 1, 3, 6, 3],
    'values':     ['Sheet1', 1, 1, 6, 1],
})

# Add a chart title.
chart_object.set_title({'name': 'Exam Score Distribution'})

# Add x-axis label
chart_object.set_x_axis({'name': 'Subjects'})

# Add y-axis label
chart_object.set_y_axis({'name': 'Marks'})

# add chart to the worksheet with given
# offset values at the top-left corner of
# a chart is anchored to cell E2
worksheet_object.insert_chart('B10', chart_object,
                              {'x_offset': 20, 'y_offset': 5})

# Close the Pandas Excel writer
# object and output the Excel file.
writer_object.save()
输出:
请参阅以下文章以获取有关使用 Xlswriter 和 Pandas 的详细信息。
- 使用 Pandas 和 XlsxWriter |套装 – 1
- 使用 Pandas 和 XlsxWriter |套装 – 2
- 使用 Pandas 和 XlsxWriter |套装 – 3