使用 Matplotlib 在图像上绘制点或线
先决条件:Matplotlib
Matplotlib 及其组成部分支持许多功能。其中一个功能是我们可以在Python中使用 Matplotlib 在图像上绘制一条线或一个点。
方法
- 导入模块
- 阅读图片
- 在图像上绘制线或点
- 显示绘图/图像。
使用的图像:

下面提供了在给定图像上使用上述方法的实现:
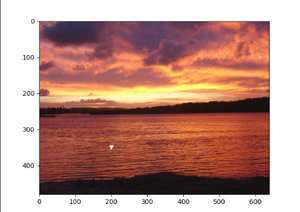
示例 1:在图像上绘制一个点。
使用的属性:标记
它用于定义点应显示在哪种标记类型中。
Python3
from matplotlib import image
from matplotlib import pyplot as plt

# to read the image stored in the working directory
data = image.imread('sunset-1404452-640x480.jpg')

# to draw a point on co-ordinate (200,300)
plt.plot(200, 350, marker='v', color="white")
plt.imshow(data)
plt.show()
Python3
from matplotlib import image
from matplotlib import pyplot as plt

# to read the image stored in the working directory
data = image.imread('sunset-1404452-640x480.jpg')

# to draw a line from (200,300) to (500,100)
x = [200, 500]
y = [300, 100]
plt.plot(x, y, color="white", linewidth=3)
plt.imshow(data)
plt.show()
Python3
from matplotlib import image
from matplotlib import pyplot as plt

# to read the image stored in the working directory
data = image.imread('sunset-1404452-640x480.jpg')

# to draw first line from (100,400) to (500,100)
# to draw second line from (150,100) to (450,400)
x1 = [100, 500]
y1 = [400, 100]
x2 = [150, 450]
y2 = [100, 400]
plt.plot(x1, y1, x2, y2, color="white", linewidth=3)
plt.axis('off')
plt.imshow(data)
plt.show()
输出:
示例 2:在图像上画一条线
为了画一条线,我们将在 plot函数中给出两点的坐标。
使用的属性:线宽
用于指定线条的宽度。
蟒蛇3
from matplotlib import image
from matplotlib import pyplot as plt

# to read the image stored in the working directory
data = image.imread('sunset-1404452-640x480.jpg')

# to draw a line from (200,300) to (500,100)
x = [200, 500]
y = [300, 100]
plt.plot(x, y, color="white", linewidth=3)
plt.imshow(data)
plt.show()
输出:

例 3:画两条相互交叉的相交线构成 X。
蟒蛇3
from matplotlib import image
from matplotlib import pyplot as plt

# to read the image stored in the working directory
data = image.imread('sunset-1404452-640x480.jpg')

# to draw first line from (100,400) to (500,100)
# to draw second line from (150,100) to (450,400)
x1 = [100, 500]
y1 = [400, 100]
x2 = [150, 450]
y2 = [100, 400]
plt.plot(x1, y1, x2, y2, color="white", linewidth=3)
plt.axis('off')
plt.imshow(data)
plt.show()
输出 :
