在Python中绘制极坐标曲线
极坐标中的点表示为 ( r , theta )。这里, r是它与原点的距离, theta是必须从原点测量 r 的角度。笛卡尔坐标系中的任何数学函数也可以使用极坐标绘制。
所需模块
- Matplotlib : Matplotlib是一个综合的Python库,用于创建静态和交互式绘图和可视化。要安装此模块,请在终端中键入以下命令。
pip install matplotlib
- Numpy : Numpy是Python中数组计算的核心库。要安装此模块,请在终端中键入以下命令。
pip install numpy
- 数学:数学 是用于执行各种数学任务的内置模块。
matplotlib.pyplot模块包含一个函数polar() ,可用于在极坐标中绘制曲线。
Syntax : matplotlib.pyplot.polar(theta, r, **kwargs)
Parameters :
- theta – angle
- r – distance
方法 :
在下面的每个示例中,
- 创建一个弧度值列表。这些值涵盖了相应函数的领域。
- 对于每个弧度值theta,根据每条曲线的特定公式计算相应的r值。
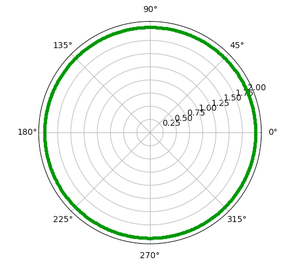
1.圆:圆是由平面中所有点组成的形状,这些点距给定点(中心)的给定距离(半径)。因此, r是一个等于半径的常数值。
例子 :
Python3
import numpy as np
import matplotlib.pyplot as plt


# setting the axes projection as polar
plt.axes(projection = 'polar')

# setting the radius
r = 2

# creating an array containing the
# radian values
rads = np.arange(0, (2 * np.pi), 0.01)

# plotting the circle
for rad in rads:
    plt.polar(rad, r, 'g.')

# display the Polar plot
plt.show()
Python3
import numpy as np
import matplotlib.pyplot as plt
import math


# setting the axes
# projection as polar
plt.axes(projection = 'polar')

# setting the values of
# semi-major and
# semi-minor axes
a = 4
b = 3

# creating an array
# containing the radian values
rads = np.arange(0, (2 * np.pi), 0.01)

# plotting the ellipse
for rad in rads:
    r = (a*b)/math.sqrt((a*np.sin(rad))**2 + (b*np.cos(rad))**2)
    plt.polar(rad, r, 'g.')

# display the polar plot
plt.show()
Python3
import numpy as np
import matplotlib.pyplot as plt
import math


# setting the axes
# projection as polar
plt.axes(projection = 'polar')

# setting the length of
# axis of cardioid
a=4

# creating an array
# containing the radian values
rads = np.arange(0, (2 * np.pi), 0.01)

# plotting the cardioid
for rad in rads:
    r = a + (a*np.cos(rad))
    plt.polar(rad,r,'g.')

# display the polar plot
plt.show()
Python3
import numpy as np
import matplotlib.pyplot as plt


# setting the axes
# projection as polar
plt.axes(projection = 'polar')

# creating an array
# containing the radian values
rads = np.arange(0, 2 * np.pi, 0.001)

# plotting the spiral
for rad in rads:
    r = rad
    plt.polar(rad, r, 'g.')

# display the polar plot
plt.show()
Python3
import numpy as np
import matplotlib.pyplot as plt


# setting the axes
# projection as polar
plt.axes(projection='polar')

# setting the length
# and number of petals
a = 1
n = 6

# creating an array
# containing the radian values
rads = np.arange(0, 2 * np.pi, 0.001)

# plotting the rose
for rad in rads:
    r = a * np.cos(n*rad)
    plt.polar(rad, r, 'g.')

# display the polar plot
plt.show()
输出 :
2. 椭圆:椭圆是一个点在平面中移动的轨迹,使得它与其他两个点(焦点)的距离之和是恒定的。这里, r定义为:

在哪里,
- a = 半长轴的长度
- b = 半短轴长度
例子 :
Python3
import numpy as np
import matplotlib.pyplot as plt
import math


# setting the axes
# projection as polar
plt.axes(projection = 'polar')

# setting the values of
# semi-major and
# semi-minor axes
a = 4
b = 3

# creating an array
# containing the radian values
rads = np.arange(0, (2 * np.pi), 0.01)

# plotting the ellipse
for rad in rads:
    r = (a*b)/math.sqrt((a*np.sin(rad))**2 + (b*np.cos(rad))**2)
    plt.polar(rad, r, 'g.')

# display the polar plot
plt.show()
输出 :

3. 心形:心形是圆的圆周上一点的轨迹,当它围绕另一个相同的圆滚动时。这里,r 定义为:

其中, a = 心形轴的长度
例子 :
Python3
import numpy as np
import matplotlib.pyplot as plt
import math


# setting the axes
# projection as polar
plt.axes(projection = 'polar')

# setting the length of
# axis of cardioid
a=4

# creating an array
# containing the radian values
rads = np.arange(0, (2 * np.pi), 0.01)

# plotting the cardioid
for rad in rads:
    r = a + (a*np.cos(rad))
    plt.polar(rad,r,'g.')

# display the polar plot
plt.show()
输出 :

4. 阿基米德螺线:阿基米德螺线是一个点在一条直线上匀速运动的轨迹,它本身围绕它的一个端点匀速转动。这里,r 定义为:

例子:
Python3
import numpy as np
import matplotlib.pyplot as plt


# setting the axes
# projection as polar
plt.axes(projection = 'polar')

# creating an array
# containing the radian values
rads = np.arange(0, 2 * np.pi, 0.001)

# plotting the spiral
for rad in rads:
    r = rad
    plt.polar(rad, r, 'g.')

# display the polar plot
plt.show()
输出 :

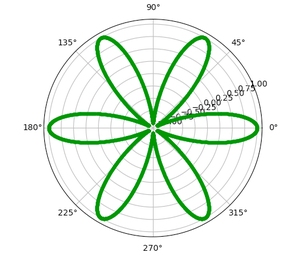
5. Rhodonea: Rhodonea 或 Rose 曲线是在极坐标中绘制的玫瑰形正弦曲线。这里,r 定义为:

在哪里,
- a = 花瓣长度
- n = 花瓣数
例子:
Python3
import numpy as np
import matplotlib.pyplot as plt


# setting the axes
# projection as polar
plt.axes(projection='polar')

# setting the length
# and number of petals
a = 1
n = 6

# creating an array
# containing the radian values
rads = np.arange(0, 2 * np.pi, 0.001)

# plotting the rose
for rad in rads:
    r = a * np.cos(n*rad)
    plt.polar(rad, r, 'g.')

# display the polar plot
plt.show()
输出 :