如何在Python中的 Plotly 中更改颜色条
在本文中,我们将学习如何在 Plotly Python中更改颜色条。
Plotly 的不同类型的色阶名称
| aggrnyl | burg | inferno | plasma | rdpu | ylgnbu | matter | geyser |
| agsunset | burgyl | jet | plotly3 | redor | ylorbr | solar | piyg |
| blackbody | cividis | magenta | pubu | reds | ylorrd | speed | picnic |
| blues | darkmint | magma | pubugn | sunset | algae | tempo | portland |
| bluered | electric | mint | purd | sunsetdark | amp | thermal | puor |
| blugrn | emrld | orrd | purp | teal | deep | turbid | rdgy |
| bluyl | gnbu | oranges | purples | tealgrn | dense | armyrose | rdylbu |
| brwnyl | greens | oryel | purpor | turbo | gray | brbg | rdylgn |
| bugn | greys | peach | rainbow | viridis | haline | earth | spectral |
| bupu | hot | pinkyl | rdbu | ylgn | ice | fall | tealrose |
| temps | tropic | balance | curl | delta | oxy | edge | hsv |
| icefire | phase | twilight | mrybm | mygbm |
句法:
我们可以通过使用色标来改变颜色。
fig = go.Figure(data=go.Scatter(
y=np.random.randn(500),
mode='markers',
marker=dict(
size=8,
# set color equal to a variable
color=np.random.randn(500),
# one of plotly colorscales
colorscale='hot',
# enable color scale
showscale=True
)
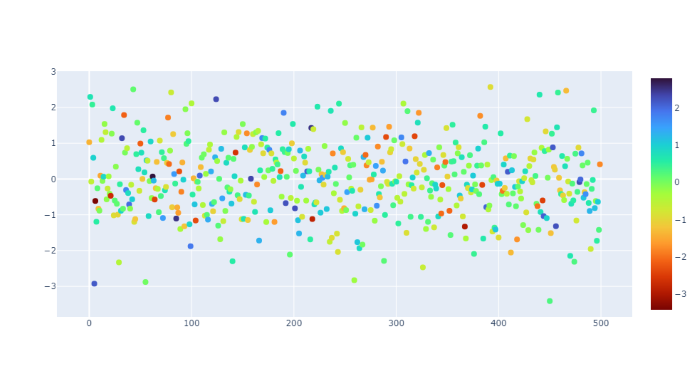
))示例 1:
Python3
# import the modules
import plotly.graph_objects as go
import numpy as np

# create figure
# from the data using numpy random method
fig = go.Figure(data=go.Scatter(
    y=np.random.randn(500),
    mode='markers',
    marker=dict(
        size=8,

        # set color equal to a variable
        color=np.random.randn(500),

        # one of plotly colorscales
        colorscale='hot',

        # enable color scale
        showscale=True
    )
))

# display figure
fig.show()
Python3
import plotly.graph_objects as go
import numpy as np

fig = go.Figure(data=go.Line(
    y = np.random.randn(500),
    mode='markers',
    marker=dict(
        size=8,
        color=np.random.randn(500), #set color equal to a variable
        colorscale='hot_r', # one of plotly colorscales
        showscale=True  # enable color scale
    )
))

fig.show()
Python3
import plotly.graph_objects as go
import numpy as np

fig = go.Figure(data=go.Scatter(
    y=np.random.randn(500),
    mode='markers',
    marker=dict(
        size=8,

        # set color equal to a variable
        color=np.random.randn(550),

        # one of plotly colorscales
        colorscale='turbo_r',

        # enable color scale
        showscale=True
    )
))
# display
fig.show()
输出:
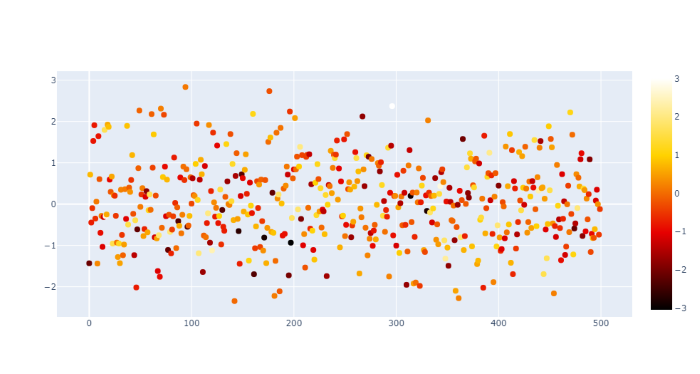
示例 2:
将颜色设置为 hot_r
Python3
import plotly.graph_objects as go
import numpy as np

fig = go.Figure(data=go.Line(
    y = np.random.randn(500),
    mode='markers',
    marker=dict(
        size=8,
        color=np.random.randn(500), #set color equal to a variable
        colorscale='hot_r', # one of plotly colorscales
        showscale=True  # enable color scale
    )
))

fig.show()
输出:
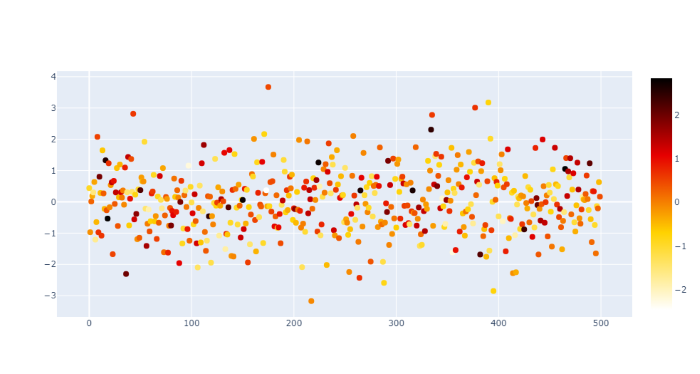
示例 3:
将颜色设置为 turbo_r
Python3
import plotly.graph_objects as go
import numpy as np

fig = go.Figure(data=go.Scatter(
    y=np.random.randn(500),
    mode='markers',
    marker=dict(
        size=8,

        # set color equal to a variable
        color=np.random.randn(550),

        # one of plotly colorscales
        colorscale='turbo_r',

        # enable color scale
        showscale=True
    )
))
# display
fig.show()
输出: