支持向量机算法
支持向量机(SVM)是一种用于分类和回归的监督机器学习算法。尽管我们说回归问题也是最适合分类的问题。 SVM 算法的目标是在 N 维空间中找到一个对数据点进行明确分类的超平面。超平面的维度取决于特征的数量。如果输入特征的数量是两个,那么超平面就是一条线。如果输入特征的数量为 3,则超平面变为二维平面。当特征数量超过三个时,就很难想象了。
让我们考虑两个自变量 x1、x2 和一个因变量,蓝色圆圈或红色圆圈。
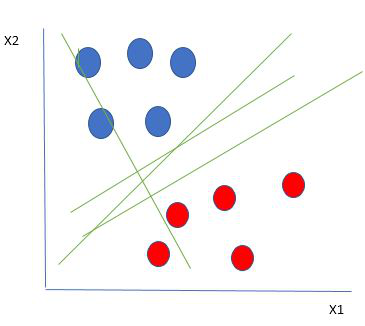
线性可分数据点
从上图中可以清楚地看出,有多条线(我们的超平面在这里是一条线,因为我们只考虑两个输入特征 x1、x2)来隔离我们的数据点或在红色和蓝色圆圈之间进行分类。那么我们如何选择最好的线或一般来说最好的超平面来隔离我们的数据点。
选择最佳超平面:
作为最佳超平面的一种合理选择是代表两个类之间最大间隔或边距的超平面。
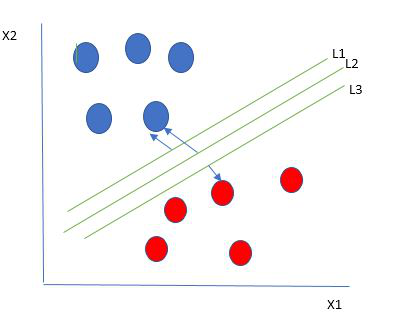
因此,我们选择距离最近的每边数据点的距离最大的超平面。如果存在这样的超平面,则它被称为最大边界超平面/硬边界。所以从上图中我们选择L2。
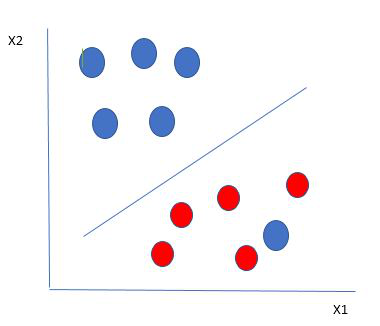
让我们考虑如下所示的场景
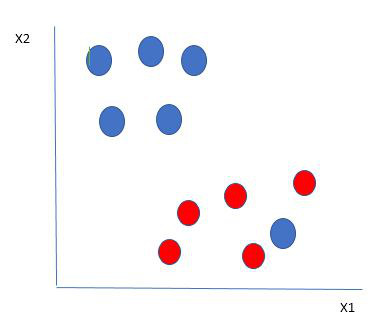
在这里,我们在红球的边界上有一个蓝球。那么SVM是如何对数据进行分类的呢?这很简单!红球边界内的蓝球是蓝球的异常值。 SVM 算法具有忽略异常值并找到使边距最大化的最佳超平面的特性。 SVM 对异常值具有鲁棒性。
因此,在这种类型的数据点中,SVM 所做的是,它找到与先前数据集一样的最大边距,并且每次点越过边距时都会增加一个惩罚。因此,此类情况下的边距称为软边距。当数据集存在软边距时,SVM 会尝试最小化(1/margin+∧(∑penalty)) 。铰链损失是一种常用的惩罚。如果没有违规就没有铰链损失。如果违规,铰链损失与违规距离成正比。
直到现在,我们都在谈论线性可分数据(蓝球和红球的组可以通过直线/线性线可分)。如果数据不是线性可分的怎么办?

比如说,我们的数据如上图所示。SVM 通过使用内核创建一个新变量来解决这个问题。我们在直线上调用一个点 x i并创建一个新变量 y i函数距原点的距离 o.so 如果我们绘制它,我们会得到如下所示的结果
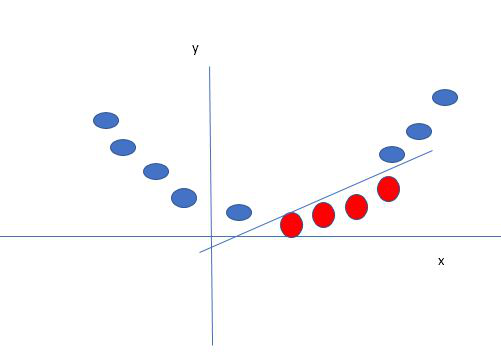
在这种情况下,新变量 y 被创建为距原点距离的函数。创建新变量的非线性函数称为内核。
支持向量机内核:
SVM核是一个将低维输入空间转化为高维空间的函数,即将不可分问题转化为可分问题。它主要用于非线性分离问题。简单地说,内核会进行一些极其复杂的数据转换,然后根据定义的标签或输出找出分离数据的过程。
支持向量机的优点:
- 在高维情况下有效
- 它的内存效率很高,因为它在决策函数中使用了一个称为支持向量的训练点子集
- 可以为决策函数指定不同的内核函数,并且可以指定自定义内核
Python中的SVM实现:
目的:预测癌症是良性还是恶性。
使用有关诊断出癌症的患者的历史数据,使医生能够根据独立的属性区分恶性病例和良性病例。
数据集:https://archive.ics.uci.edu/ml/datasets/Breast+Cancer+Wisconsin+(原文)
Python
# import libraries
import pandas as pd
import numpy as np
import seaborn as sns
import matplotlib.pyplot as plt
%matplotlib inline
# Importing Data file
data = pd.read_csv('bc2.csv')
dataset = pd.DataFrame(data)
dataset.columns
Python
dataset.info()Python
dataset.describe().transpose()Python
dataset = dataset.replace('?', np.nan)
dataset = dataset.apply(lambda x: x.fillna(x.median()),axis=0)

# converting the hp column from object 'Bare Nuclei'/ string type to float
dataset['Bare Nuclei'] = dataset['Bare Nuclei'].astype('float64')
dataset.isnull().sum()
Python
from sklearn.model_selection import train_test_split

# To calculate the accuracy score of the model
from sklearn.metrics import accuracy_score, confusion_matrix

target = dataset["Class"]
features = dataset.drop(["ID","Class"], axis=1)
X_train, X_test, y_train, y_test = train_test_split(features,target, test_size = 0.2, random_state = 10)
from sklearn.svm import SVC

# Building a Support Vector Machine on train data
svc_model = SVC(C= .1, kernel='linear', gamma= 1)
svc_model.fit(X_train, y_train)

prediction = svc_model .predict(X_test)
# check the accuracy on the training set
print(svc_model.score(X_train, y_train))
print(svc_model.score(X_test, y_test))
Python
print("Confusion Matrix:\n",confusion_matrix(prediction,y_test))Python
# Building a Support Vector Machine on train data
svc_model = SVC(kernel='rbf')
svc_model.fit(X_train, y_train)
Python
print(svc_model.score(X_train, y_train))
print(svc_model.score(X_test, y_test))
Python
#Building a Support Vector Machine on train data(changing the kernel)
svc_model  = SVC(kernel='poly')
svc_model.fit(X_train, y_train)

prediction = svc_model.predict(X_test)

print(svc_model.score(X_train, y_train))
print(svc_model.score(X_test, y_test))
Python
svc_model = SVC(kernel='sigmoid')
svc_model.fit(X_train, y_train)

prediction = svc_model.predict(X_test)

print(svc_model.score(X_train, y_train))
print(svc_model.score(X_test, y_test))
输出:
Index(['ID', 'ClumpThickness', 'Cell Size', 'Cell Shape', 'Marginal Adhesion',
'Single Epithelial Cell Size', 'Bare Nuclei', 'Normal Nucleoli', 'Bland Chromatin',
'Mitoses', 'Class'], dtype='object')
Python
dataset.info()
输出:
RangeIndex: 699 entries, 0 to 698
Data columns (total 11 columns):
ID                             699 non-null int64
ClumpThickness       699 non-null int64
Cell Size                    699 non-null int64
Cell Shape                 699 non-null int64
Marginal Adhesion     699 non-null int64
Single Epithelial Cell Size    699 non-null int64
Bare Nuclei                    699 non-null object
Normal Nucleoli            699 non-null int64
Bland Chromatin           699 non-null int64
Mitoses                         699 non-null int64
Class                             699 non-null int64
dtypes: int64(10), object(1)
memory usage: 60.1+ KB
Python
dataset.describe().transpose()
输出: count mean std min 25% 50% 75% max ID 699 1.071704e+06 617095.729819 61634.0 870688.5 1171710.0 1238298.0 13454352.0 clump Thickness 699 4.417740e+00 2.815741 1.0 2.0 4.0 6.0 10.0 Cell Size 699.0 4.417740e+00 2.815741 1.0 1.0 1.0 5.0 10.0 Cell Shape 699.0 3.134478e+00 3.051459 1.0 1.0 1.0 5.0 10.0 Marginal Adhension 699.0 2.806867e+00 2.971913 1.0 1.0 1.0 4.0 10.0 Single Epithelial cell size 699.0 3.216023e+00 2.855379 1.0 2.0 2.0 4.0 10.0 Normal Nucleoli 699.0 3.437768e+00 2.214300 1.0 2.0 3.0 5.0 10.0 Bland chromatin 699.0 2.866953e+00 2.438364 1.0 1.0 1.0 4.0 10.0 Mitoses 699.0 1.589413e+00 3.053634 1.0 1.0 1.0 1.0 10.0 class 699.0 2.689557e+00 1.715078 2.0 2.0 2.0 4.0 4.0
Python
dataset = dataset.replace('?', np.nan)
dataset = dataset.apply(lambda x: x.fillna(x.median()),axis=0)

# converting the hp column from object 'Bare Nuclei'/ string type to float
dataset['Bare Nuclei'] = dataset['Bare Nuclei'].astype('float64')
dataset.isnull().sum()
输出:
ID                                               0
ClumpThickness                         0
Cell Size                                      0
Cell Shape                                   0
Marginal Adhesion                     0
Single Epithelial Cell Size            0
Bare Nuclei                                  0
Normal Nucleoli                          0
Bland Chromatin                         0
Mitoses                                        0
Class                                             0
dtype: int64
Python
from sklearn.model_selection import train_test_split

# To calculate the accuracy score of the model
from sklearn.metrics import accuracy_score, confusion_matrix

target = dataset["Class"]
features = dataset.drop(["ID","Class"], axis=1)
X_train, X_test, y_train, y_test = train_test_split(features,target, test_size = 0.2, random_state = 10)
from sklearn.svm import SVC

# Building a Support Vector Machine on train data
svc_model = SVC(C= .1, kernel='linear', gamma= 1)
svc_model.fit(X_train, y_train)

prediction = svc_model .predict(X_test)
# check the accuracy on the training set
print(svc_model.score(X_train, y_train))
print(svc_model.score(X_test, y_test))
输出:
0.9749552772808586
0.9642857142857143
Python
print("Confusion Matrix:\n",confusion_matrix(prediction,y_test))
输出:
Confusion Matrix:
[[95  2]
[ 3 40]]
Python
# Building a Support Vector Machine on train data
svc_model = SVC(kernel='rbf')
svc_model.fit(X_train, y_train)
输出:
SVC(C=1.0, cache_size=200, class_weight=None, coef0=0.0,
 decision_function_shape='ovr', degree=3, gamma='auto_deprecated',
 kernel='rbf', max_iter=-1, probability=False, random_state=None,
 shrinking=True, tol=0.001, verbose=False)
Python
print(svc_model.score(X_train, y_train))
print(svc_model.score(X_test, y_test))
输出:
0.998211091234347
0.9571428571428572
Python
#Building a Support Vector Machine on train data(changing the kernel)
svc_model  = SVC(kernel='poly')
svc_model.fit(X_train, y_train)

prediction = svc_model.predict(X_test)

print(svc_model.score(X_train, y_train))
print(svc_model.score(X_test, y_test))
输出:
1.0
0.9357142857142857
Python
svc_model = SVC(kernel='sigmoid')
svc_model.fit(X_train, y_train)

prediction = svc_model.predict(X_test)

print(svc_model.score(X_train, y_train))
print(svc_model.score(X_test, y_test))
输出:
0.3434704830053667
0.32857142857142857