Python中的 Matplotlib.ticker.AutoLocator 类
Matplotlib是Python中用于数组二维图的惊人可视化库。 Matplotlib 是一个基于 NumPy 数组构建的多平台数据可视化库,旨在与更广泛的 SciPy 堆栈配合使用。
matplotlib.ticker.AutoLocator
matplotlib.ticker.AutoLocator 类是 matplotlib.ticker.MaxNLocator 的子类,具有参数 nbins = 'auto' 和steps = [1, 2, 2.5, 5, 10]。它用于动态查找主要刻度位置。
Syntax:class matplotlib.ticker.AutoLocator
Parameters:
- nbins: It is either an integer or ‘auto’, where the integer value represents the maximum number of intervals; one less than max number of ticks. The number of bins gets automatically determined on the basis of the length of the axis.It is an optional argument and has a default value of 10.
- steps: It is an optional parameter representing a nice number sequence that starts from 1 and ends with 10.
- integer: It is an optional boolean value. If set True, the ticks accepts only integer values, provided at least min_n_ticks integers are within the view limits.
- symmetric: It is an optional value. If set to True, auto-scaling will result in a range symmetric about zero.
- prune: It is an optional parameter that accepts either of the four values: {‘lower’, ‘upper’, ‘both’, None}. By default it is None.
示例 1:
Python3
import matplotlib
import matplotlib.pyplot as plt
import numpy as np


fig, axes = plt.subplots(3, 4,
                         sharex = 'row',
                         sharey = 'row',
                         squeeze = False)

data = np.random.rand(20, 2, 10)

for ax in axes.flatten()[:-1]:

    ax.plot(*np.random.randn(2, 10), marker ="o", ls ="")


# Now remove axes[1, 5] from
# the grouper for xaxis
axes[2, 3].get_shared_x_axes().remove(axes[2, 3])

# Create and assign new ticker
xticker = matplotlib.axis.Ticker()
axes[2, 3].xaxis.major = xticker

# The new ticker needs new locator
# and formatters
xloc = matplotlib.ticker.AutoLocator()
xfmt = matplotlib.ticker.ScalarFormatter()

axes[2, 3].xaxis.set_major_locator(xloc)
axes[2, 3].xaxis.set_major_formatter(xfmt)

# Now plot to the "ungrouped" axes
axes[2, 3].plot(np.random.randn(10)*100 + 100,
                np.linspace(-3, 3, 10),
                marker ="o", ls ="",
                color ="green")

plt.show()
Python3
import pylab as pl
from matplotlib import ticker


# helper function
def AutoLocatorInit(self):

    ticker.MaxNLocator.__init__(self,
                                nbins = 4,
                                steps =[1, 2, 5, 10])


ticker.AutoLocator.__init__ = AutoLocatorInit

pl.plot(pl.randn(100))
pl.figure()
pl.hist(pl.randn(1000), bins = 40)

pl.show()
输出:

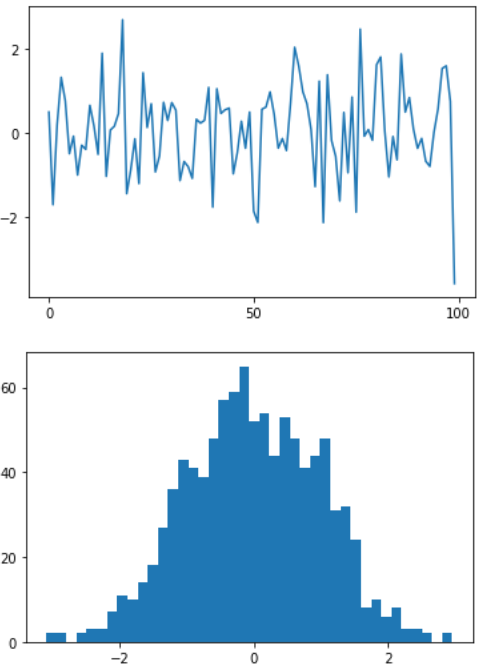
示例 2:
Python3
import pylab as pl
from matplotlib import ticker


# helper function
def AutoLocatorInit(self):

    ticker.MaxNLocator.__init__(self,
                                nbins = 4,
                                steps =[1, 2, 5, 10])


ticker.AutoLocator.__init__ = AutoLocatorInit

pl.plot(pl.randn(100))
pl.figure()
pl.hist(pl.randn(1000), bins = 40)

pl.show()
输出: