在Python中使用 Seaborn 按均值对箱线图进行排序
Seaborn 是一个了不起的可视化库,用于在Python中绘制统计图形。它提供了漂亮的默认样式和调色板,使统计图更具吸引力。它建立在 matplotlib 库的顶部,并且还与 Pandas 的数据结构紧密集成。
箱线图是通过四分位数描述的数值数据组的可视化表示。 Boxplot 还用于检测数据集中的异常值。它使用简单的盒子和胡须有效地捕获数据摘要,并允许我们轻松地进行跨组比较。箱线图使用第 25、50 和 75 个百分位数汇总样本数据。这些百分位数也称为下四分位数、中位数和上四分位数。
有时,我们想根据需要对箱线图进行排序,您可以通过多种方式订购箱线图,它们是:
- 手动箱线图顺序
- 使用均值对箱线图进行排序
在本文中,我们将讨论如何使用均值对箱线图进行排序。
使用什么排序箱线图?
当我们有多个组时,建议手动使用均值或中位数排序,排序会变得困难。
循序渐进的方法:
- 导入库
Python3
# import required modules
import numpy as np
import pandas as pd
import seaborn as sns
import matplotlib.pyplot as plt
Python3
# creating dataset
df = pd.DataFrame({
    'Ice-cream': np.random.normal(57, 5, 100),
    'Chocolate': np.random.normal(73, 5, 100),
    'cupcake': np.random.normal(68, 8, 100),
    'jamroll': np.random.normal(37, 10, 100),
    'cake': np.random.normal(76, 5, 100),

})
df.head()
Python3
# plot th data into boxplot

sns.boxplot(data=df)

# Label x-axis
plt.xlabel('Desserts')

# labels y-axis
plt.ylabel('perference of people')
Python3
# This will give the indices of the sorted
# values into the ascending order the default
# value in sort_values is ascending = True
index_sort = df.mean().sort_values().index
index_sort
Python3
# now applying the sorted
# indices to the data
df_sorted = df[index_sort]
Python3
# plotting the boxplot for the data
sns.boxplot(data = df_sorted)

# Label x-axis
plt.xlabel('Desserts')

# labels y-axis
plt.ylabel('perference of people')
Python3
# import required modules
import numpy as np
import pandas as pd
import seaborn as sns
import matplotlib.pyplot as plt


# creating dataset
df = pd.DataFrame({
    'Ice-cream': np.random.normal(57, 5, 100),
    'Chocolate': np.random.normal(73, 5, 100),
    'cupcake': np.random.normal(68, 8, 100),
    'jamroll': np.random.normal(37, 10, 100),
    'cake': np.random.normal(76, 5, 100),

})


# sort on the basis of mean
index_sort = df.mean().sort_values().index

# now applying the sorted indices to the data
df_sorted = df[index_sort]


# plotting the boxplot for the data
sns.boxplot(data = df_sorted)

# Label x-axis
plt.xlabel('Desserts')

# labels y-axis
plt.ylabel('perference of people')- 创建数据集
蟒蛇3
# creating dataset
df = pd.DataFrame({
    'Ice-cream': np.random.normal(57, 5, 100),
    'Chocolate': np.random.normal(73, 5, 100),
    'cupcake': np.random.normal(68, 8, 100),
    'jamroll': np.random.normal(37, 10, 100),
    'cake': np.random.normal(76, 5, 100),

})
df.head()
输出:

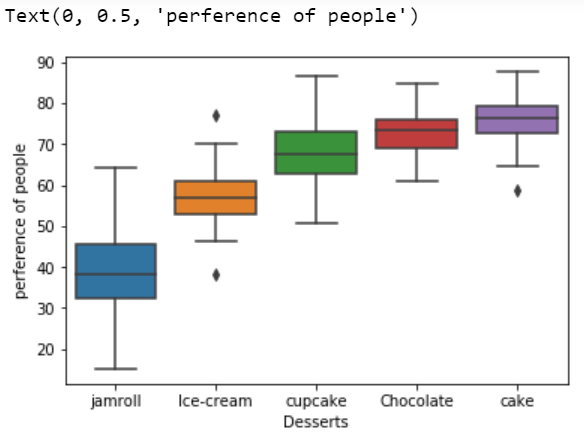
- 在对箱线图进行排序之前绘制数据。
蟒蛇3
# plot th data into boxplot

sns.boxplot(data=df)

# Label x-axis
plt.xlabel('Desserts')

# labels y-axis
plt.ylabel('perference of people')
输出:
- 现在首先对数据进行排序并获得排序的索引,因为我们必须使用均值对箱线图进行排序,因此我们将对数据应用mean()和sort_values函数。
蟒蛇3
# This will give the indices of the sorted
# values into the ascending order the default
# value in sort_values is ascending = True
index_sort = df.mean().sort_values().index
index_sort
输出:

- 使用排序索引,我们可以对我们创建的数据框进行排序。
蟒蛇3
# now applying the sorted
# indices to the data
df_sorted = df[index_sort]
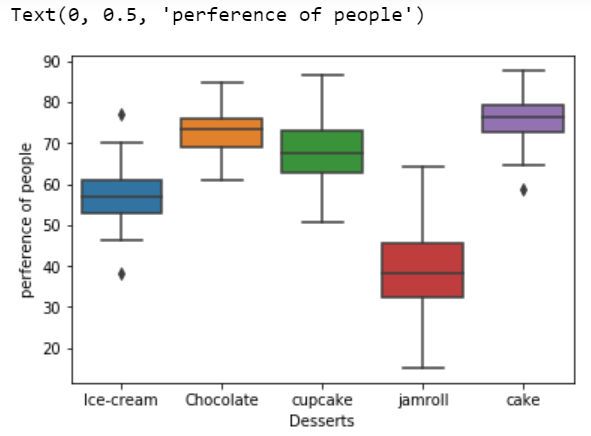
所以我们已经对数据进行了排序,让我们绘制数据的箱线图。
蟒蛇3
# plotting the boxplot for the data
sns.boxplot(data = df_sorted)

# Label x-axis
plt.xlabel('Desserts')

# labels y-axis
plt.ylabel('perference of people')
输出:

如果想按降序排序,请使用以下语法:
index_sort = df.mean().sort_values(ascending=False).index
以下是基于上述方法的完整程序:
蟒蛇3
# import required modules
import numpy as np
import pandas as pd
import seaborn as sns
import matplotlib.pyplot as plt


# creating dataset
df = pd.DataFrame({
    'Ice-cream': np.random.normal(57, 5, 100),
    'Chocolate': np.random.normal(73, 5, 100),
    'cupcake': np.random.normal(68, 8, 100),
    'jamroll': np.random.normal(37, 10, 100),
    'cake': np.random.normal(76, 5, 100),

})


# sort on the basis of mean
index_sort = df.mean().sort_values().index

# now applying the sorted indices to the data
df_sorted = df[index_sort]


# plotting the boxplot for the data
sns.boxplot(data = df_sorted)

# Label x-axis
plt.xlabel('Desserts')

# labels y-axis
plt.ylabel('perference of people')
输出: