局部加权线性回归的实现
LOESS 或 LOWESS 是非参数回归方法,它在基于 k 最近邻的元模型中组合了多个回归模型。 LOESS 结合了线性最小二乘回归的大部分简单性和非线性回归的灵活性。它通过将简单模型拟合到数据的局部子集来构建一个函数来逐点描述数据的变化。
- 该算法用于在特征之间存在非线性关系时进行预测。
- 局部加权线性回归是一种监督学习算法。
- 它是一种非参数算法。
- done不存在训练阶段。所有工作都是在测试阶段/进行预测时完成的。
假设我们要在某个查询点 x 处评估假设函数h。对于线性回归,我们将执行以下操作: 

对于局部加权线性回归,我们将改为执行以下操作: 
 其中 w(i) 是 a 是与训练点 x(i) 相关的非负“权重”。训练集中位于 x 附近的点比远离 x 的点具有更高的“偏好”。所以对于靠近查询点 x 的 x(i),w(i) 的值较大,而对于远离 x 的 x(i),w(i) 的值较小。
w(i) 可以选择为 – 
直接使用封闭Form解求参数—— 
代码:导入库:
python
import numpy as np
import matplotlib.pyplot as plt
import pandas as pd

plt.style.use("seaborn")
python
# Loading CSV files from local storage
dfx = pd.read_csv('weightedX_LOWES.csv')
dfy = pd.read_csv('weightedY_LOWES.csv')
# Getting data from DataFrame Object and storing in numpy n-dim arrays
X = dfx.values
Y = dfy.values
python
# function to calculate W weight diagonal Matrix used in calculation of predictions
def get_WeightMatrix_for_LOWES(query_point, Training_examples, Bandwidth):
  # M is the No of training examples
  M = Training_examples.shape[0]
  # Initialising W with identity matrix
  W = np.mat(np.eye(M))
  # calculating weights for query points
  for i in range(M):
    xi = Training_examples[i]
    denominator = (-2 * Bandwidth * Bandwidth)
    W[i, i] = np.exp(np.dot((xi-query_point), (xi-query_point).T)/denominator)
    return W
python
# function to make predictions
def predict(training_examples, Y, query_x, Bandwidth):
  M = Training_examples.shape[0]
  all_ones = np.ones((M, 1))
  X_ = np.hstack((training_examples, all_ones))
  qx = np.mat([query_x, 1])
  W = get_WeightMatrix_for_LOWES(qx, X_, Bandwidth)
  # calculating parameter theta
  theta = np.linalg.pinv(X_.T*(W * X_))*(X_.T*(W * Y))
  # calculating predictions
  pred = np.dot(qx, theta)
  return theta, pred
python
# visualise predicted values with respect
# to original target values
Bandwidth = 0.1
X_test = np.linspace(-2, 2, 20)
Y_test = []
for query in X_test:
theta, pred = predict(X, Y, query, Bandwidth)
Y_test.append(pred[0][0])
horizontal_axis = np.array(X)
vertical_axis = np.array(Y)
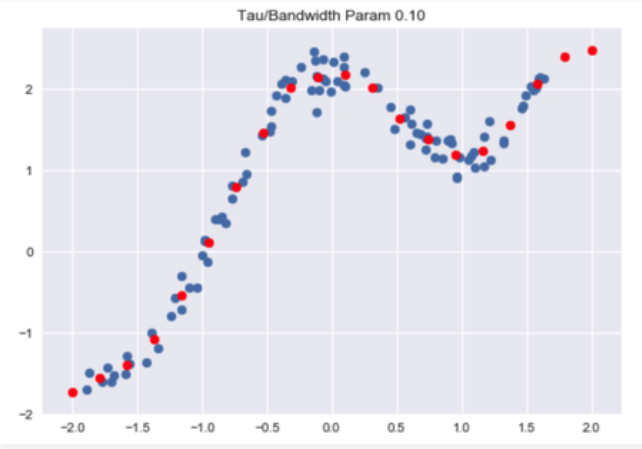
plt.title("Tau / Bandwidth Param %.2f"% Bandwidth)
plt.scatter(horizontal_axis, vertical_axis)
Y_test = np.array(Y_test)
plt.scatter(X_test, Y_test, color ='red')
plt.show()代码:加载数据:
Python
# Loading CSV files from local storage
dfx = pd.read_csv('weightedX_LOWES.csv')
dfy = pd.read_csv('weightedY_LOWES.csv')
# Getting data from DataFrame Object and storing in numpy n-dim arrays
X = dfx.values
Y = dfy.values
输出:
代码:计算权重矩阵的函数:
Python
# function to calculate W weight diagonal Matrix used in calculation of predictions
def get_WeightMatrix_for_LOWES(query_point, Training_examples, Bandwidth):
  # M is the No of training examples
  M = Training_examples.shape[0]
  # Initialising W with identity matrix
  W = np.mat(np.eye(M))
  # calculating weights for query points
  for i in range(M):
    xi = Training_examples[i]
    denominator = (-2 * Bandwidth * Bandwidth)
    W[i, i] = np.exp(np.dot((xi-query_point), (xi-query_point).T)/denominator)
    return W
代码:做出预测:
Python
# function to make predictions
def predict(training_examples, Y, query_x, Bandwidth):
  M = Training_examples.shape[0]
  all_ones = np.ones((M, 1))
  X_ = np.hstack((training_examples, all_ones))
  qx = np.mat([query_x, 1])
  W = get_WeightMatrix_for_LOWES(qx, X_, Bandwidth)
  # calculating parameter theta
  theta = np.linalg.pinv(X_.T*(W * X_))*(X_.T*(W * Y))
  # calculating predictions
  pred = np.dot(qx, theta)
  return theta, pred
代码:可视化预测:
Python
# visualise predicted values with respect
# to original target values

Bandwidth = 0.1
X_test = np.linspace(-2, 2, 20)
Y_test = []
for query in X_test:
  theta, pred = predict(X, Y, query, Bandwidth)
  Y_test.append(pred[0][0])
horizontal_axis = np.array(X)
vertical_axis = np.array(Y)
plt.title("Tau / Bandwidth Param %.2f"% Bandwidth)
plt.scatter(horizontal_axis, vertical_axis)
Y_test = np.array(Y_test)
plt.scatter(X_test, Y_test, color ='red')
plt.show()