📌 相关文章
- R-线性回归(1)
- 线性回归 (1)
- R线性回归(1)
- Python线性回归(1)
- python中的线性回归(1)
- Python线性回归
- python代码示例中的线性回归
- 线性回归 - Javascript 代码示例
- 线性回归 - 无论代码示例
- 回归算法-线性回归(1)
- 回归算法-线性回归
- python 线性回归 - Python (1)
- TensorFlow中的线性回归
- TensorFlow-线性回归
- TensorFlow-线性回归(1)
- TensorFlow中的线性回归(1)
- Python中的单变量线性回归(1)
- Python中的单变量线性回归
- python 线性回归 - Python 代码示例
- 线性回归(Python实现)
- 线性回归(Python实现)
- 线性回归(Python实现)(1)
- 统计-线性回归(1)
- 统计-线性回归
- PyTorch-线性回归
- PyTorch线性回归(1)
- PyTorch-线性回归(1)
- PyTorch线性回归
- 使用R的简单线性回归
📜 R线性回归
📅 最后修改于: 2021-01-08 10:02:21 🧑 作者: Mango
线性回归
线性回归用于基于一个或多个输入预测变量x预测结果变量y的值。换句话说,线性回归用于在预测变量和响应变量之间建立线性关系。
在线性回归中,预测变量和响应变量通过方程式关联,其中两个变量的指数均为1。在数学上,当绘制为图形时,线性关系表示一条直线。
有以下用于线性回归的一般数学方程式:
y = ax + b
这里,
- y是一个响应变量。
- x是一个预测变量。
- a和b是称为系数的常数。
建立回归的步骤
一个人的身高已知时对体重的预测就是回归的一个简单例子。要预测体重,我们需要在一个人的身高和体重之间建立关系。
可以按照以下步骤创建关系:
- 第一步,我们进行实验,收集一个观察到的身高和体重值的样本。
- 之后,我们使用R的lm()函数创建一个关系模型。
- 接下来,我们将在模型的帮助下找到系数,并使用该系数创建数学方程。
- 我们将获得关系模型的摘要,以了解预测中的平均误差,称为残差。
- 最后,我们使用predict()函数预测新人的体重。
lm()函数具有以下语法:
lm(formula,data)
这里,
| S.No | Parameters | Description |
|---|---|---|
| 1. | Formula | It is a symbol that presents the relationship between x and y. |
| 2. | Data | It is a vector on which we will apply the formula. |
创建关系模型并获取系数
让我们开始执行第二步和第三步,即创建一个关系模型并获取系数。我们将使用lm()函数并传递x和y输入向量,并将结果存储在名为Relationship_model的变量中。
例
#Creating input vector for lm() function
x <- c(141, 134, 178, 156, 108, 116, 119, 143, 162, 130)
y <- c(62, 85, 56, 21, 47, 17, 76, 92, 62, 58)
# Applying the lm() function.
relationship_model<- lm(y~x)
#Printing the coefficient
print(relationship_model)
输出:
Call:
lm(formula = y ~ x)

Coefficients:
(Intercept)            x
   47.50833      0.07276
关系模型摘要
我们将使用summary()函数获取关系模型的摘要。让我们看一个示例,以了解summary()函数的用法。
例
#Creating input vector for lm() function
x <- c(141, 134, 178, 156, 108, 116, 119, 143, 162, 130)
y <- c(62, 85, 56, 21, 47, 17, 76, 92, 62, 58)

# Applying the lm() function.
relationship_model<- lm(y~x)

#Printing the coefficient
print(summary(relationship_model))
输出:
Call:
lm(formula = y ~ x)

Residuals:
    Min      1Q  Median      3Q     Max
-38.948  -7.390   1.869  15.933  34.087

Coefficients:
            Estimate Std. Error t value Pr(>|t|)
(Intercept) 47.50833   55.18118   0.861    0.414
x            0.07276    0.39342   0.185    0.858

Residual standard error: 25.96 on 8 degrees of freedom
Multiple R-squared:  0.004257,    Adjusted R-squared:  -0.1202
F-statistic: 0.0342 on 1 and 8 DF,  p-value: 0.8579
的predict()函数
现在,我们将借助predict()函数预测新人的体重。预测函数的语法如下:
predict(object, newdata)
这里,
| S.No | Parameter | Description |
|---|---|---|
| 1. | object | It is the formula that we have already created using the lm() function. |
| 2. | Newdata | It is the vector that contains the new value for the predictor variable. |
例
#Creating input vector for lm() function
x <- c(141, 134, 178, 156, 108, 116, 119, 143, 162, 130)
y <- c(62, 85, 56, 21, 47, 17, 76, 92, 62, 58)

# Applying the lm() function.
relationship_model<- lm(y~x)

# Finding the weight of a person with height 170.
z <- data.frame(x = 160)
predict_result<-  predict(relationship_model,z)
print(predict_result)
输出:
1
59.14977
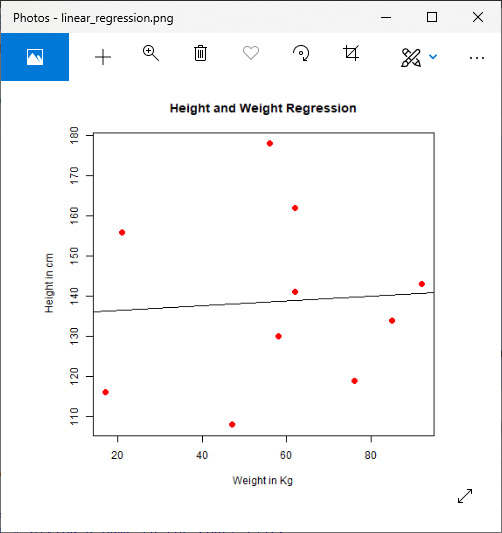
绘制回归
现在,我们借助plot()函数绘制预测结果。此函数将参数x和y作为输入向量和更多参数。
例
#Creating input vector for lm() function
x <- c(141, 134, 178, 156, 108, 116, 119, 143, 162, 130)
y <- c(62, 85, 56, 21, 47, 17, 76, 92, 62, 58)
relationship_model<- lm(y~x)
# Giving a name to the chart file.
png(file = "linear_regression.png")
# Plotting the chart.
plot(y,x,col = "red",main = "Height and Weight Regression",abline(lm(x~y)),cex = 1.3,pch = 16,xlab = "Weight in Kg",ylab = "Height in cm")
# Saving the file.
dev.off()
输出: