在 R 中设置 ggplot2 绘图的区域边距
在本文中,我们将讨论如何在 R 编程语言中设置 ggplot2 图的区域边距。
要做到这一点调用主题()函数,利用此函数的plot.margin参数与所需的数据这样的说法按照用户的要求。
theme()函数是自定义绘图的非数据组件的强大方法:即标题、标签、字体、背景、网格线和图例。
Syntax:
theme(plot.margin,….)
Parameters:
- plot.margin: -margin around the entire plot (unit with the sizes of the top, right, bottom, and left margins)
让我们看几个实现来熟悉这个概念
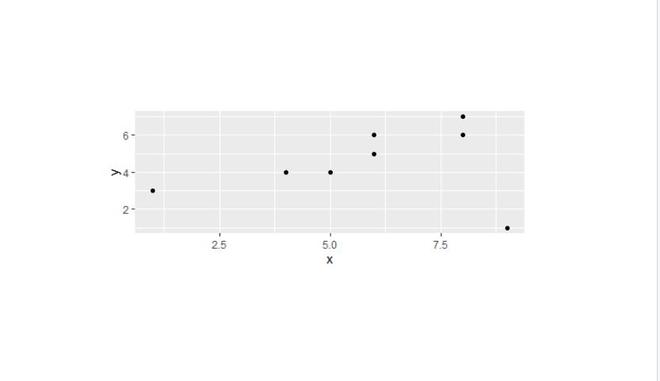
示例 1a:初始绘图
R
library('ggplot2')

gfg<-data.frame(x=c(8,6,5,1,8,9,6,4),
                y=c(6,5,4,3,7,1,6,4))
gfg_plot <- ggplot(gfg, aes(x, y)) + geom_point()

gfg_plot
R
library('ggplot2')

gfg<-data.frame(x=c(8,6,5,1,8,9,6,4),
                y=c(6,5,4,3,7,1,6,4))
gfg_plot <- ggplot(gfg, aes(x, y)) + geom_point()
gfg_plot+theme(plot.margin = unit(c(4,4,4,4), "cm"))
R
library('ggplot2')

gfg<-data.frame(x=c(8,6,5,1,8,9,6,4),
                y=c(6,5,4,3,7,1,6,4))
gfg_plot <- ggplot(gfg, aes(x, y)) +geom_bar(stat="identity")

gfg_plot
R
library('ggplot2')

gfg<-data.frame(x=c(8,6,5,1,8,9,6,4),
                y=c(6,5,4,3,7,1,6,4))
gfg_plot <- ggplot(gfg, aes(x, y)) +geom_bar(stat="identity")

gfg_plot+theme(plot.margin = unit(c(5,5,5,5), "cm"))
输出:
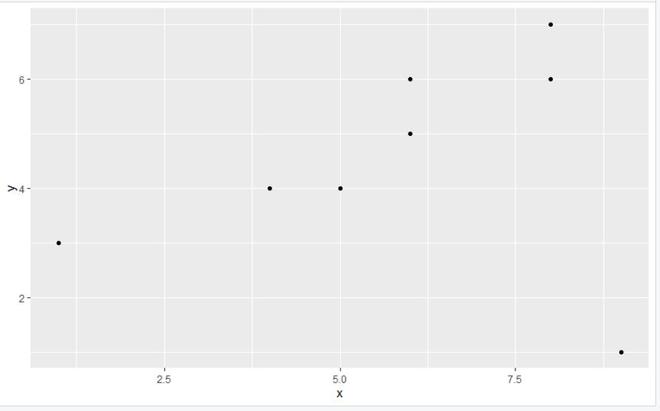
示例 1b:最终绘图
电阻
library('ggplot2')

gfg<-data.frame(x=c(8,6,5,1,8,9,6,4),
                y=c(6,5,4,3,7,1,6,4))
gfg_plot <- ggplot(gfg, aes(x, y)) + geom_point()
gfg_plot+theme(plot.margin = unit(c(4,4,4,4), "cm"))
输出:
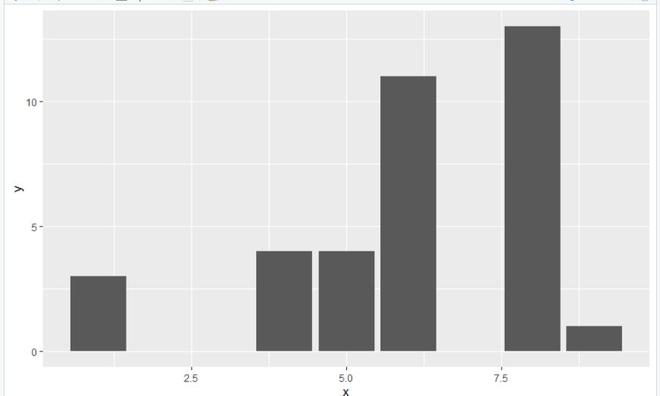
示例 2a:初始绘图
电阻
library('ggplot2')

gfg<-data.frame(x=c(8,6,5,1,8,9,6,4),
                y=c(6,5,4,3,7,1,6,4))
gfg_plot <- ggplot(gfg, aes(x, y)) +geom_bar(stat="identity")

gfg_plot
输出:
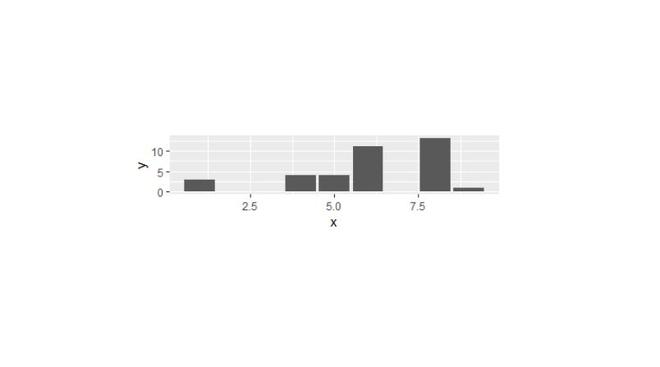
示例 2b:最终绘图
电阻
library('ggplot2')

gfg<-data.frame(x=c(8,6,5,1,8,9,6,4),
                y=c(6,5,4,3,7,1,6,4))
gfg_plot <- ggplot(gfg, aes(x, y)) +geom_bar(stat="identity")

gfg_plot+theme(plot.margin = unit(c(5,5,5,5), "cm"))
输出: