将文本添加到 R 中的 ggplot2 绘图
在本文中,我们将看到如何在 R 编程语言中将文本添加到 ggplot2 图中。
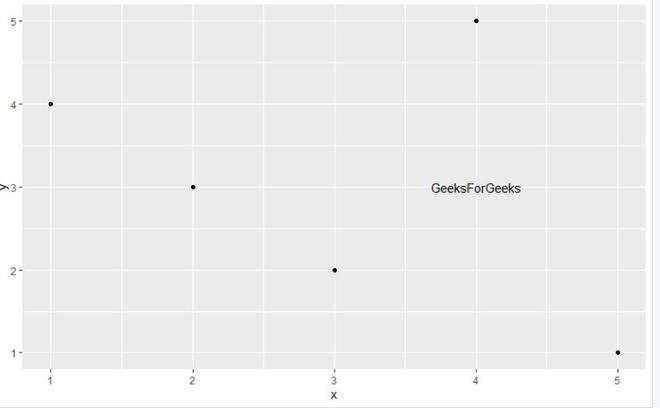
为此,使用了 annotate() 。它可用于添加小注释(例如文本标签),或者如果您将数据放在向量中,并且出于某种原因不想将它们放入数据框中。
Syntax:
annotate(geom,x = NULL,y = NULL, xmin = NULL, xmax = NULL, ymin = NULL, ymax = NULL, xend = NULL, yend = NULL, …, na.rm = FALSE)
Parameters:
- geom: name of geom to use for annotation
- x, y, xmin, ymin, xmax, ymax, xend, yend: positioning aesthetics – you must specify at least one of these.
- …: Other arguments passed on to layer(). These are often aesthetics, used to set an aesthetic to a fixed value, like color = “red” or size = 3.
- na.rm: If FALSE, the default, missing values are removed with a warning.
例子:
R
library("ggplot2")

gfg_data <- data.frame(x = c(1,2,3,4,5),
                   y = c(4,3,2,5,1))
gfg_data

gfg_plot<- ggplot(gfg_data, aes(x, y)) +
  geom_point()

gfg_plot +  annotate("text", x = 4, y = 3,
                     label = "GeeksForGeeks")
R
library("ggplot2")

gfg_data <- data.frame(x = c(1,2,3,4,5),
                   y = c(4,3,2,5,1))
gfg_data

gfg_plot<- ggplot(gfg_data, aes(x, y)) +
  geom_point()

gfg_plot +  annotate("text", x = 1.2, y = 5,
                     label = "GeeksForGeeks") +
annotate("text", x = 4.7, y = 1,
         label = "GeeksForGeeks")
R
library("ggplot2")

gfg_data <- data.frame(x = c(1,2,3,4,5),
                   y = c(4,3,2,5,1))

gfg_data

gfg_plot<- ggplot(gfg_data, aes(x, y)) +
  geom_point()

gfg_plot +  annotate("text", x = 2, y = 5,
                     label = "GeeksForGeeks",
                     col = "green", size = 10) +
  annotate("text", x = 4.7, y = 1,
           label = "GeeksForGeeks",
           col = "green", size = 5)
输出:
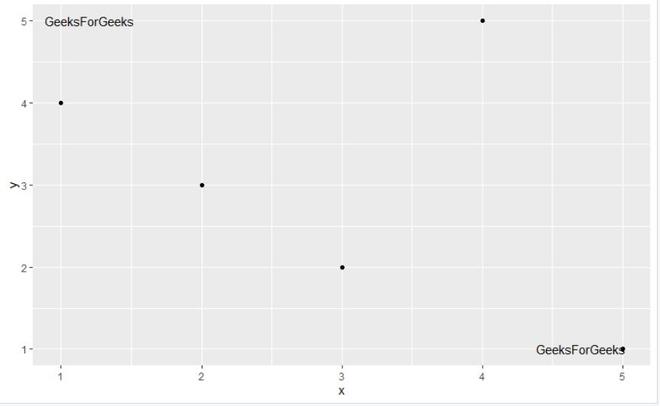
要将多个测试元素注释到 ggplot2 绘图,用户需要使用 R 编程语言中的所需参数多次调用 ggplot2 包的 annotate()函数。
例子:
电阻
library("ggplot2")

gfg_data <- data.frame(x = c(1,2,3,4,5),
                   y = c(4,3,2,5,1))
gfg_data

gfg_plot<- ggplot(gfg_data, aes(x, y)) +
  geom_point()

gfg_plot +  annotate("text", x = 1.2, y = 5,
                     label = "GeeksForGeeks") +
annotate("text", x = 4.7, y = 1,
         label = "GeeksForGeeks")
输出:
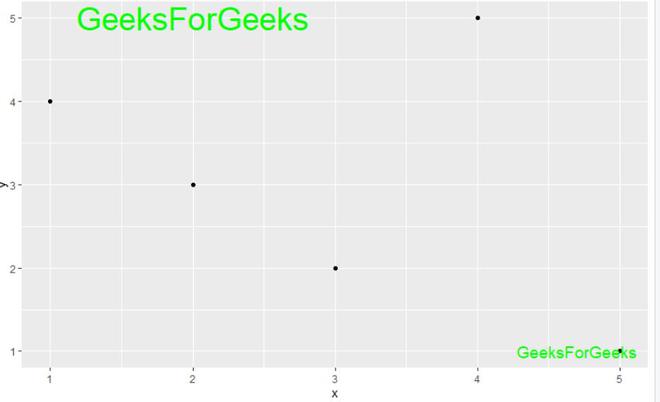
要使用 annotate()函数修改添加到 ggplot2 图中的文本的颜色和大小,用户需要添加col和size作为 ggplot2 包中的 annotate函数的参数,并在此函数和此函数指定所需的参数将导致在 R 编程语言中添加到 ggplot2 绘图的文本的大小和颜色发生变化。
例子:
电阻
library("ggplot2")

gfg_data <- data.frame(x = c(1,2,3,4,5),
                   y = c(4,3,2,5,1))

gfg_data

gfg_plot<- ggplot(gfg_data, aes(x, y)) +
  geom_point()

gfg_plot +  annotate("text", x = 2, y = 5,
                     label = "GeeksForGeeks",
                     col = "green", size = 10) +
  annotate("text", x = 4.7, y = 1,
           label = "GeeksForGeeks",
           col = "green", size = 5)
输出: