将垂直线和水平线添加到 R 中的 ggplot2 绘图
在本文中,我们将看到如何使用 R 编程语言中的 ggplot2 向绘图添加垂直线和水平线。
使用 geom_vline() 向 R 图中添加垂直线
为了将垂直线添加到 R 图中, geom_vline()在指定位置绘制一条垂直线。
Syntax: geom_vline(xintercept)
Parameter: here xintercept is used control the X position of line.
Return: Vertical line on R plot.
示例:要在绘图上添加垂直线,我们只需将geom_vline()函数添加到 ggplot2()函数并传递xintercept ,它基本上在 X 轴上有一个位置,我们实际上要在该位置创建一条垂直线。这里我们将2011设置为 xintercept。
R
# load ggplot2 package
library(ggplot2)

# Create a dataframe for Plot data
data <- data.frame(year = c(2011, 2012, 2013, 2014, 2015),
                   point = c(10, 20, 30, 40, 50))

# Plot the scatter plot with vertical line
# at X=2011
ggplot(data, aes(year, point)) +
  ggtitle("Point Chart")+
  geom_point(aes(size = 1.0), col = "green")+
  geom_vline(xintercept = 2011)
R
# load ggplot2 package
library(ggplot2)

# Create a dataframe for Plot data
data <- data.frame(year = c(2011, 2012, 2013, 2014, 2015),
                   point = c(10, 20, 30, 40, 50))

# Plot the scatter plot with horizontal
# line at Y=20
ggplot(data, aes(year, point)) +
  ggtitle("Point Chart")+
  geom_point(aes(size = 1.0), col = "green")+
  geom_hline(yintercept = 20)
R
# load ggplot2 package
library(ggplot2)

# Create a dataframe for Plot data
data <- data.frame(year = c(2011, 2012, 2013, 2014, 2015),
                   point = c(10, 20, 30, 40, 50))

# Plot the scatter plot with both lines
# at X=2012 and Y=20
ggplot(data, aes(year, point)) +
  ggtitle("Point Chart")+
  geom_point(aes(size = 1.0), col = "green")+
  geom_vline(xintercept = 2012)+
  geom_hline(yintercept = 20)
R
# load ggplot2 package
library(ggplot2)

# Create a dataframe for Plot data
data <- data.frame(year = c(2011, 2012, 2013, 2014, 2015),
                   point = c(10, 20, 30, 40, 50))

# Plot the scatter plot with multiple
# vertical and horizontal lines
ggplot(data, aes(year, point)) +
  ggtitle("Point Chart")+
  geom_point(aes(size = 1.0), col = "green")+
  geom_vline(xintercept = seq(from=2011, to=2015, by = 0.5))+
  geom_hline(yintercept = seq(from=10, to=50, by = 5))
输出:
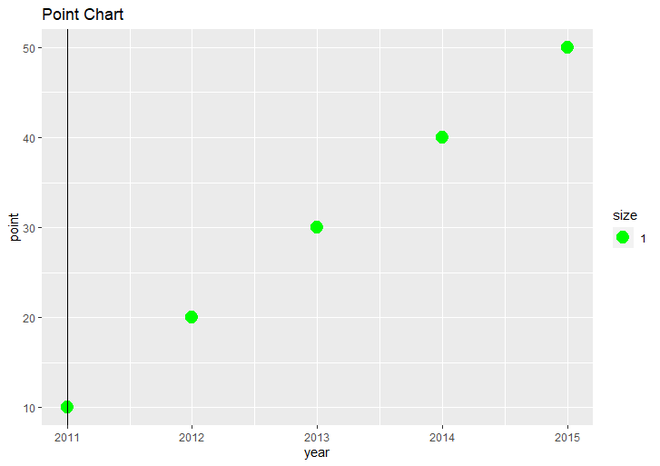
在 X=2011 处具有垂直线的散点图
使用 geom_hline() 将水平线添加到 R 图
为了向 R 图中添加水平线,我们将使用geom_hline()函数:
Syntax: geom_hline(yintercept)
Parameter: here yintercept is used control the y position of line.
Return: Horizontal line on R plot.
示例:要在绘图上添加水平线,我们只需将geom_hline()函数添加到 ggplot2()函数并传递 yintercept,它基本上在 Y 轴,我们实际上要在其中创建一条垂直线。这里我们将 xintercept 设置为20 。
电阻
# load ggplot2 package
library(ggplot2)

# Create a dataframe for Plot data
data <- data.frame(year = c(2011, 2012, 2013, 2014, 2015),
                   point = c(10, 20, 30, 40, 50))

# Plot the scatter plot with horizontal
# line at Y=20
ggplot(data, aes(year, point)) +
  ggtitle("Point Chart")+
  geom_point(aes(size = 1.0), col = "green")+
  geom_hline(yintercept = 20)
输出:
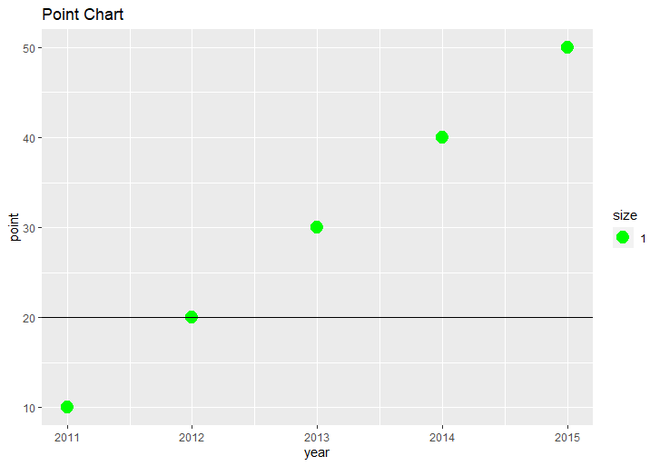
Y=20 水平线的散点图
将垂直线和水平线添加到 R 图中
要添加这两行,我们将geom_vline()和geom_hline()函数到 ggplot()函数并设置 xintercept 和 yintercept 的值。
示例:这里我们将在X=2012处绘制垂直线,在Y=20处绘制垂直线。
电阻
# load ggplot2 package
library(ggplot2)

# Create a dataframe for Plot data
data <- data.frame(year = c(2011, 2012, 2013, 2014, 2015),
                   point = c(10, 20, 30, 40, 50))

# Plot the scatter plot with both lines
# at X=2012 and Y=20
ggplot(data, aes(year, point)) +
  ggtitle("Point Chart")+
  geom_point(aes(size = 1.0), col = "green")+
  geom_vline(xintercept = 2012)+
  geom_hline(yintercept = 20)
输出:
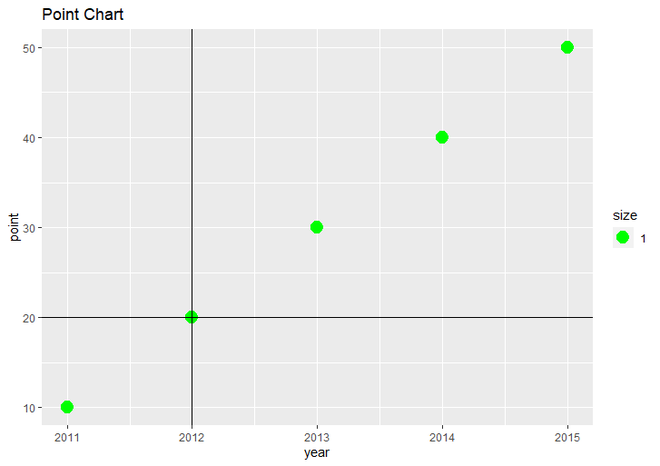
两条线在 X=2012 和 Y=20 处的散点图
使用 seq()函数向 R 图中添加多条垂直和水平线
我们将使用seq()函数来表示xintercept和yintercept ,所有其他设置将保持与示例 3 相同。
Syntax: seq(from, to, by)
Parameters:
- from : it is used to represent starting length.
- to: it is used to represent ending length.
- by: it represents increment of the system.
Return: well-formed sequence.
示例:这里我们绘制了 2011 年到 2015 年之间相差0.5 的垂直线和10 到 50 之间相差5 的水平线。
电阻
# load ggplot2 package
library(ggplot2)

# Create a dataframe for Plot data
data <- data.frame(year = c(2011, 2012, 2013, 2014, 2015),
                   point = c(10, 20, 30, 40, 50))

# Plot the scatter plot with multiple
# vertical and horizontal lines
ggplot(data, aes(year, point)) +
  ggtitle("Point Chart")+
  geom_point(aes(size = 1.0), col = "green")+
  geom_vline(xintercept = seq(from=2011, to=2015, by = 0.5))+
  geom_hline(yintercept = seq(from=10, to=50, by = 5))
输出:
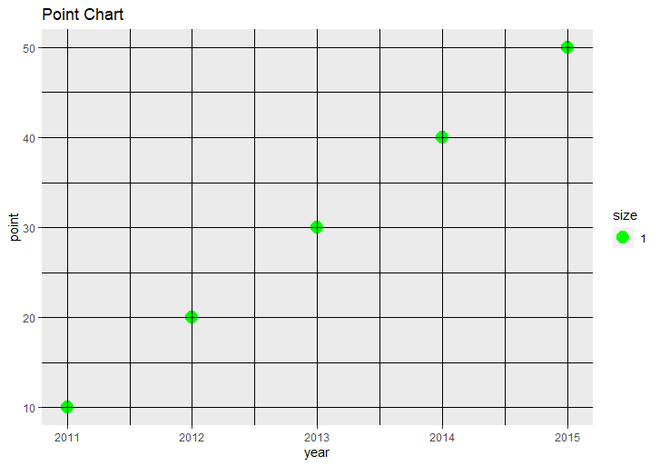
具有多条垂直和水平线的散点图