Machine Learning – the study of computer algorithms that improve automatically through experience. It is seen as a subset of artificial intelligence.
分类是将给定数据集分类为类的过程。
在机器学习(ML)中,您可以对问题进行框架化,收集和清理数据,添加一些必要的特征变量(如果有),训练模型,测量其性能,通过使用某些成本函数对其进行改进,然后就可以开始使用了。部署。
但是我们如何衡量它的性能呢?有什么特别的功能要看吗?
一个简单而广泛的答案是将实际值与预测值进行比较。但这不能解决问题。
让我们考虑著名的MNIST数据集并尝试分析问题。
Python3
# Importing the dataset.
from sklearn.datasets import fetch_openml
mnist = fetch_openml('mnist_784', version=1)

# Creating independent and dependent variables.
X, y = mnist['data'], mnist['target']

# Splitting the data into training set and test set.
X_train, X_test, y_train, y_test = X[:60000], X[60000:], y[:60000], y[60000:]

"""
The training set is already shuffled for us, which is good as this guarantees that all
cross-validation folds will be similar.
"""

# Training a binary classifier.
y_train_5 = (y_train == 5) # True for all 5s, False for all other digits.
y_test_5 = (y_test == 5)

"""
Building a dumb classifier that just classifies every single image in the “not-5” class.
"""

from sklearn.model_selection import cross_val_score
from sklearn.base import BaseEstimator
class Never5Classifier(BaseEstimator):
    def fit(self, X, y=None):
        pass
    def predict(self, X):
        return np.zeros((len(X), 1), dtype=bool)

never_5_clf = Never5Classifier()
cross_val_score(never_5_clf, X_train, y_train_5, cv=3, scoring="accuracy")
Python3
# Creating some predictions.
from sklearn.model_selection import cross_val_predict
y_train_pred = cross_val_predict(sgd_clf, X_train, y_train_5, cv=3)

"""
You could make predictions on the test set, but use the test set only at the very end of your project, once you have a classifier that you are ready to launch.
"""

# Constructing the confusion matrix.
from sklearn.metrics import confusion_matrix
confusion_matrix(y_train_5, y_train_pred)
Python3
# Finding precision and recall
from sklearn.metrics import precision_score, recall_score
precision_score(y_train_5, y_train_pred)
recall_score(y_train_5, y_train_pred)
Python3
# To compute the F1 score, simply call the f1_score() function:
from sklearn.metrics import f1_score
f1_score(y_train_5, y_train_pred)
如果您在IDE上执行相同的代码,您将获得一系列精度超过90%的精度!这仅仅是因为只有大约10%的图像是5s,所以如果您总是猜一个图像不是5s,那么大约90%的时间是正确的。
这说明了为什么准确性通常不是分类器的首选性能指标,尤其是在处理偏斜的数据集时(即,某些类比其他类更频繁时)。
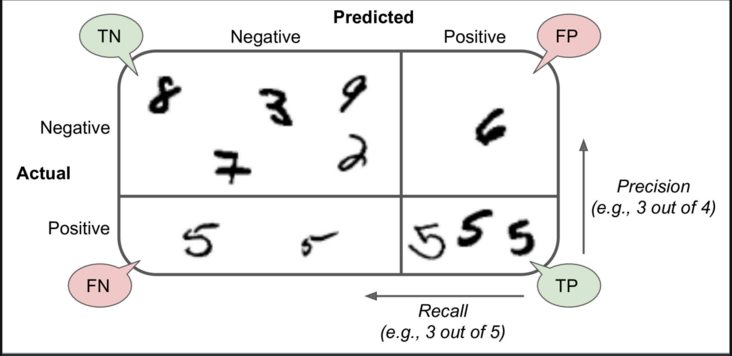
混淆矩阵
评估分类器性能的一种更好的方法是查看混淆矩阵。总体思路是计算类A的实例被分类为类B的次数。例如,要知道分类器将5s与3s混淆的图像的次数,您可以查看分类器的第5行和第3列混淆矩阵。
Python3
# Creating some predictions.
from sklearn.model_selection import cross_val_predict
y_train_pred = cross_val_predict(sgd_clf, X_train, y_train_5, cv=3)

"""
You could make predictions on the test set, but use the test set only at the very end of your project, once you have a classifier that you are ready to launch.
"""

# Constructing the confusion matrix.
from sklearn.metrics import confusion_matrix
confusion_matrix(y_train_5, y_train_pred)
混淆矩阵中的每一行代表一个实际类别,而每一列则代表一个预测类别。有关混乱矩阵的更多信息,请单击此处。
混淆矩阵为您提供了很多信息,但有时您可能更希望使用更简洁的指标。
- 精确
精度=(TP)/(TP + FP)
TP是真阳性的数量,FP是假阳性的数量。
获得完美精度的一种简单方法是做出一个肯定的预测,并确保它是正确的(精度= 1/1 = 100%)。这将不是很有用,因为分类器将忽略除一个肯定实例之外的所有实例。 - 记起
召回率=(TP)/(TP + FN)
Python3
# Finding precision and recall
from sklearn.metrics import precision_score, recall_score
precision_score(y_train_5, y_train_pred)
recall_score(y_train_5, y_train_pred)
现在,您的5探测器看起来不像您看它的准确性时那样有光泽。当它声称图像代表5时,只有72.9%(精度)的时间是正确的。而且,它仅检测到5s中的75.6%(召回)。
将精度和召回率组合到一个称为F1分数的单一度量中通常很方便,尤其是在您需要比较两个分类器的简单方法时。
F1分数是精确度和召回率的谐波平均值
Python3
# To compute the F1 score, simply call the f1_score() function:
from sklearn.metrics import f1_score
f1_score(y_train_5, y_train_pred)
F1分数偏向于具有相似精度和召回率的分类器。
这并不总是您想要的:在某些情况下,您最关心的是精度,而在其他情况下,您真正在意的是召回率。例如,如果您训练了一个分类器来检测对儿童安全的视频,则您可能更喜欢一个分类器,该分类器拒绝许多优质视频(回想率低),但仅保留安全视频(高精度),而不是一个分类器,该分类器具有很多优点召回率较高,但会使您的产品中出现一些糟糕的视频(在这种情况下,您甚至可能希望添加人工渠道来检查分类器的视频选择)。另一方面,假设您训练分类器以在监视图像上检测入店行窃者:如果分类器仅具有30%的精确度(只要其具有99%的召回率),那可能很好(确保安全警卫会收到一些错误警报,但几乎所有的入店行窃者都会被抓到)。
不幸的是,您不能同时兼顾:提高精度会降低召回率,反之亦然。这称为精度/调用权衡。