先决条件
我们将在使用Tensorflow进行线性回归之前简要概述一下线性回归。由于我们将不涉及线性回归或Tensorflow的详细信息,请阅读以下文章以获取更多详细信息:
- 线性回归(Python实现)
- TensorFlow简介
- 使用Tensorflow进行Tensor简介
线性回归的简要概述
线性回归是一种非常常见的统计方法,它使我们能够从给定的连续数据集中学习函数或关系。例如,我们给定x和对应y一些数据点,我们需要学习它们之间的关系,这称为假设。
在线性回归的情况下,假设是一条直线,即![]()
其中w是一个称为权重的矢量, b是一个称为Bias的标量。权重和偏差称为模型的参数。
我们需要做的就是从给定的数据集中估计w和b的值,以使结果假设产生的最小成本J由以下成本函数定义![]()
其中m是给定数据集中的数据点数。此成本函数也称为均方误差。
为了找到J最小的参数的优化值,我们将使用一种称为Gradient Descent的常用优化器算法。以下是渐变下降的伪代码:
Repeat untill Convergence {
    w = w - α * δJ/δw
    b = b - α * δJ/δb
}
其中α是称为学习率的超参数。
张量流
Tensorflow是Google提供的开源计算库。对于创建需要高端数值计算和/或需要将图形处理单元用于计算目的的应用程序,它是一种流行的选择。这些是Tensorflow成为机器学习应用程序(尤其是深度学习)最受欢迎的选择之一的主要原因。它还具有诸如Estimator之类的API,这些API在构建机器学习应用程序时可提供高水平的抽象。在本文中,我们不会使用任何高级API,而是将在懒惰执行模式下使用低级Tensorflow构建线性回归模型,在此期间Tensorflow创建有向无环图或DAG来跟踪所有计算,然后执行在Tensorflow Session中完成的所有计算。
执行
我们将从导入必要的库开始。我们将使用Numpy以及Tensorflow进行计算,并使用Matplotlib进行绘图。
import numpy as np
import tensorflow as tf
import matplotlib.pyplot as plt
为了使随机数可预测,我们将为Numpy和Tensorflow定义固定种子。
np.random.seed(101)
tf.set_random_seed(101)
现在,让我们生成一些随机数据来训练线性回归模型。
# Genrating random linear data
# There will be 50 data points ranging from 0 to 50
x = np.linspace(0, 50, 50)
y = np.linspace(0, 50, 50)

# Adding noise to the random linear data
x += np.random.uniform(-4, 4, 50)
y += np.random.uniform(-4, 4, 50)

n = len(x) # Number of data points
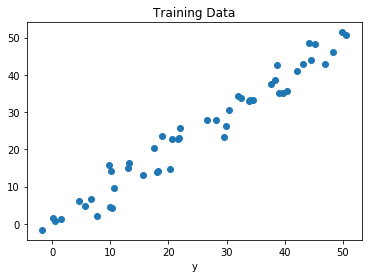
让我们可视化训练数据。
# Plot of Training Data
plt.scatter(x, y)
plt.xlabel('x')
plt.xlabel('y')
plt.title("Training Data")
plt.show()
输出:

现在,我们将通过定义占位符X和Y来开始创建模型,以便在训练过程中将训练示例X和Y馈入优化器。
X = tf.placeholder("float")
Y = tf.placeholder("float")
现在我们将为Weights和Bias声明两个可训练的Tensorflow变量,并使用np.random.randn()对其进行随机初始化。
W = tf.Variable(np.random.randn(), name = "W")
b = tf.Variable(np.random.randn(), name = "b")
现在,我们将定义模型的超参数,学习率和历元数。
learning_rate = 0.01
training_epochs = 1000
现在,我们将构建假设,成本函数和优化器。我们不会手动实现Gradient Descent Optimizer,因为它内置在Tensorflow中。之后,我们将初始化变量。
# Hypothesis
y_pred = tf.add(tf.multiply(X, W), b)

# Mean Squared Error Cost Function
cost = tf.reduce_sum(tf.pow(y_pred-Y, 2)) / (2 * n)

# Gradient Descent Optimizer
optimizer = tf.train.GradientDescentOptimizer(learning_rate).minimize(cost)

# Global Variables Initializer
init = tf.global_variables_initializer()
现在我们将在Tensorflow会话中开始训练过程。
# Starting the Tensorflow Session
with tf.Session() as sess:

    # Initializing the Variables
    sess.run(init)

    # Iterating through all the epochs
    for epoch in range(training_epochs):

        # Feeding each data point into the optimizer using Feed Dictionary
        for (_x, _y) in zip(x, y):
            sess.run(optimizer, feed_dict = {X : _x, Y : _y})

        # Displaying the result after every 50 epochs
        if (epoch + 1) % 50 == 0:
            # Calculating the cost a every epoch
            c = sess.run(cost, feed_dict = {X : x, Y : y})
            print("Epoch", (epoch + 1), ": cost =", c, "W =", sess.run(W), "b =", sess.run(b))

    # Storing necessary values to be used outside the Session
    training_cost = sess.run(cost, feed_dict ={X: x, Y: y})
    weight = sess.run(W)
    bias = sess.run(b)
输出:
Epoch: 50 cost = 5.8868036 W = 0.9951241 b = 1.2381054
Epoch: 100 cost = 5.7912707 W = 0.99812365 b = 1.0914398
Epoch: 150 cost = 5.7119675 W = 1.0008028 b = 0.96044314
Epoch: 200 cost = 5.6459413 W = 1.0031956 b = 0.8434396
Epoch: 250 cost = 5.590799 W = 1.0053328 b = 0.7389357
Epoch: 300 cost = 5.544608 W = 1.007242 b = 0.6455922
Epoch: 350 cost = 5.5057883 W = 1.008947 b = 0.56222
Epoch: 400 cost = 5.473066 W = 1.01047 b = 0.48775345
Epoch: 450 cost = 5.4453845 W = 1.0118302 b = 0.42124167
Epoch: 500 cost = 5.421903 W = 1.0130452 b = 0.36183488
Epoch: 550 cost = 5.4019217 W = 1.0141305 b = 0.30877414
Epoch: 600 cost = 5.3848577 W = 1.0150996 b = 0.26138115
Epoch: 650 cost = 5.370246 W = 1.0159653 b = 0.21905091
Epoch: 700 cost = 5.3576994 W = 1.0167387 b = 0.18124212
Epoch: 750 cost = 5.3468933 W = 1.0174294 b = 0.14747244
Epoch: 800 cost = 5.3375573 W = 1.0180461 b = 0.11730931
Epoch: 850 cost = 5.3294764 W = 1.0185971 b = 0.090368524
Epoch: 900 cost = 5.322459 W = 1.0190892 b = 0.0663058
Epoch: 950 cost = 5.3163586 W = 1.0195289 b = 0.044813324
Epoch: 1000 cost = 5.3110332 W = 1.0199214 b = 0.02561663
现在让我们看一下结果。
# Calculating the predictions
predictions = weight * x + bias
print("Training cost =", training_cost, "Weight =", weight, "bias =", bias, '\n')
输出:
Training cost = 5.3110332 Weight = 1.0199214 bias = 0.02561663请注意,在这种情况下,权重和偏差均为标量。这是因为,我们仅考虑了out训练数据中的一个因变量。如果训练数据集中有m个因变量,则权重将是m维向量,而偏差将是标量。
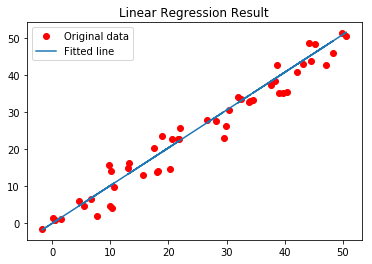
最后,我们将绘制结果。
# Plotting the Results
plt.plot(x, y, 'ro', label ='Original data')
plt.plot(x, predictions, label ='Fitted line')
plt.title('Linear Regression Result')
plt.legend()
plt.show()
输出:
