使用Python统计
一般来说,统计是收集数据、制表和解释数值数据的方法。它是应用数学的一个领域,涉及数据收集分析、解释和展示。通过统计,我们可以看到如何使用数据来解决复杂的问题。
在本教程中,我们将学习使用Python解决统计问题,还将了解其背后的概念。让我们首先了解一些在整篇文章中都很有用的概念。
注意:我们将在Python提供的统计模块的帮助下介绍描述性统计。
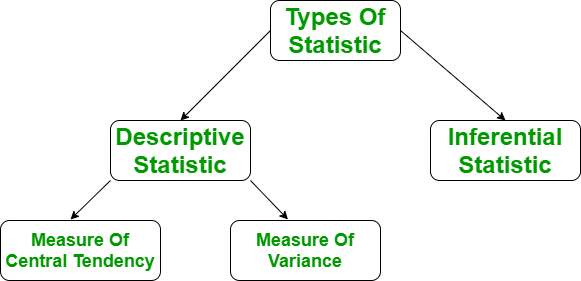
了解描述性统计
通俗地说,描述性统计一般是指借助图表、表格、Excel文件等具有代表性的方法对数据进行描述。找到一些未来的趋势。描述和总结单个变量称为单变量分析。描述两个变量之间的统计关系称为双变量分析。描述多个变量之间的统计关系称为多变量分析。
有两种类型的描述性统计——
- 集中趋势的测度
- 可变性的测量
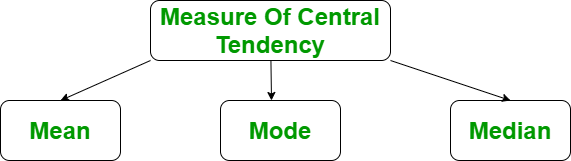
集中趋势的测度
集中趋势的度量是试图描述整个数据集的单个值。集中趋势的三个主要特征——
- 意思
- 中位数
- 中低
- 中高
- 模式
意思
它是观察值的总和除以观察值的总数。它也被定义为平均值,即总和除以计数。

均值() 函数返回在其参数中传递的数据的平均值或平均值。如果传递的参数为空,则引发StatisticsError 。
例子:
Python3
# Python code to demonstrate the working of
# mean()

# importing statistics to handle statistical
# operations
import statistics

# initializing list
li = [1, 2, 3, 3, 2, 2, 2, 1]

# using mean() to calculate average of list
# elements
print ("The average of list values is : ",end="")
print (statistics.mean(li))
Python3
# Python code to demonstrate the
# working of median() on various
# range of data-sets

# importing the statistics module
from statistics import median

# Importing fractions module as fr
from fractions import Fraction as fr

# tuple of positive integer numbers
data1 = (2, 3, 4, 5, 7, 9, 11)

# tuple of floating point values
data2 = (2.4, 5.1, 6.7, 8.9)

# tuple of fractional numbers
data3 = (fr(1, 2), fr(44, 12),
        fr(10, 3), fr(2, 3))

# tuple of a set of negative integers
data4 = (-5, -1, -12, -19, -3)

# tuple of set of positive
# and negative integers
data5 = (-1, -2, -3, -4, 4, 3, 2, 1)

# Printing the median of above datasets
print("Median of data-set 1 is % s" % (median(data1)))
print("Median of data-set 2 is % s" % (median(data2)))
print("Median of data-set 3 is % s" % (median(data3)))
print("Median of data-set 4 is % s" % (median(data4)))
print("Median of data-set 5 is % s" % (median(data5)))
Python3
# Python code to demonstrate the
# working of median_low()

# importing the statistics module
import statistics

# simple list of a set of integers
set1 = [1, 3, 3, 4, 5, 7]

# Print median of the data-set

# Median value may or may not
# lie within the data-set
print("Median of the set is % s"
    % (statistics.median(set1)))

# Print low median of the data-set
print("Low Median of the set is % s "
    % (statistics.median_low(set1)))
Python3
# Working of median_high() and median() to
# demonstrate the difference between them.

# importing the statistics module
import statistics

# simple list of a set of integers
set1 = [1, 3, 3, 4, 5, 7]

# Print median of the data-set

# Median value may or may not
# lie within the data-set
print("Median of the set is %s"
    % (statistics.median(set1)))

# Print high median of the data-set
print("High Median of the set is %s "
    % (statistics.median_high(set1)))
Python3
# Python code to demonstrate the
# working of mode() function
# on a various range of data types

# Importing the statistics module
from statistics import mode

# Importing fractions module as fr
# Enables to calculate harmonic_mean of a
# set in Fraction
from fractions import Fraction as fr

# tuple of positive integer numbers
data1 = (2, 3, 3, 4, 5, 5, 5, 5, 6, 6, 6, 7)

# tuple of a set of floating point values
data2 = (2.4, 1.3, 1.3, 1.3, 2.4, 4.6)

# tuple of a set of fractional numbers
data3 = (fr(1, 2), fr(1, 2), fr(10, 3), fr(2, 3))

# tuple of a set of negative integers
data4 = (-1, -2, -2, -2, -7, -7, -9)

# tuple of strings
data5 = ("red", "blue", "black", "blue", "black", "black", "brown")


# Printing out the mode of the above data-sets
print("Mode of data set 1 is % s" % (mode(data1)))
print("Mode of data set 2 is % s" % (mode(data2)))
print("Mode of data set 3 is % s" % (mode(data3)))
print("Mode of data set 4 is % s" % (mode(data4)))
print("Mode of data set 5 is % s" % (mode(data5)))
Python3
# Sample Data
arr = [1, 2, 3, 4, 5]

#Finding Max
Maximum = max(arr)
# Finding Min
Minimum = min(arr)

# Difference Of Max and Min
Range = Maximum-Minimum
print("Maximum = {}, Minimum = {} and Range = {}".format(
    Maximum, Minimum, Range))
Python3
# Python code to demonstrate variance()
# function on varying range of data-types

# importing statistics module
from statistics import variance

# importing fractions as parameter values
from fractions import Fraction as fr

# tuple of a set of positive integers
# numbers are spread apart but not very much
sample1 = (1, 2, 5, 4, 8, 9, 12)

# tuple of a set of negative integers
sample2 = (-2, -4, -3, -1, -5, -6)

# tuple of a set of positive and negative numbers
# data-points are spread apart considerably
sample3 = (-9, -1, -0, 2, 1, 3, 4, 19)

# tuple of a set of fractional numbers
sample4 = (fr(1, 2), fr(2, 3), fr(3, 4),
           fr(5, 6), fr(7, 8))

# tuple of a set of floating point values
sample5 = (1.23, 1.45, 2.1, 2.2, 1.9)

# Print the variance of each samples
print("Variance of Sample1 is % s " % (variance(sample1)))
print("Variance of Sample2 is % s " % (variance(sample2)))
print("Variance of Sample3 is % s " % (variance(sample3)))
print("Variance of Sample4 is % s " % (variance(sample4)))
print("Variance of Sample5 is % s " % (variance(sample5)))
Python3
# Python code to demonstrate stdev()
# function on various range of datasets

# importing the statistics module
from statistics import stdev

# importing fractions as parameter values
from fractions import Fraction as fr

# creating a varying range of sample sets
# numbers are spread apart but not very much
sample1 = (1, 2, 5, 4, 8, 9, 12)

# tuple of a set of negative integers
sample2 = (-2, -4, -3, -1, -5, -6)

# tuple of a set of positive and negative numbers
# data-points are spread apart considerably
sample3 = (-9, -1, -0, 2, 1, 3, 4, 19)

# tuple of a set of floating point values
sample4 = (1.23, 1.45, 2.1, 2.2, 1.9)

# Print the standard deviation of
# following sample sets of observations
print("The Standard Deviation of Sample1 is % s"
      % (stdev(sample1)))

print("The Standard Deviation of Sample2 is % s"
      % (stdev(sample2)))

print("The Standard Deviation of Sample3 is % s"
      % (stdev(sample3)))


print("The Standard Deviation of Sample4 is % s"
      % (stdev(sample4)))
输出:
The average of list values is : 2中位数
它是数据集的中间值。它将数据分成两半。如果数据集中的元素数量是奇数,则中心元素是中位数,如果是偶数,则中位数将是两个中心元素的平均值。
对于奇数:

对于偶数:

median()函数用于计算中位数,即数据的中间元素。如果传递的参数为空,则引发StatisticsError 。
例子:
蟒蛇3
# Python code to demonstrate the
# working of median() on various
# range of data-sets

# importing the statistics module
from statistics import median

# Importing fractions module as fr
from fractions import Fraction as fr

# tuple of positive integer numbers
data1 = (2, 3, 4, 5, 7, 9, 11)

# tuple of floating point values
data2 = (2.4, 5.1, 6.7, 8.9)

# tuple of fractional numbers
data3 = (fr(1, 2), fr(44, 12),
        fr(10, 3), fr(2, 3))

# tuple of a set of negative integers
data4 = (-5, -1, -12, -19, -3)

# tuple of set of positive
# and negative integers
data5 = (-1, -2, -3, -4, 4, 3, 2, 1)

# Printing the median of above datasets
print("Median of data-set 1 is % s" % (median(data1)))
print("Median of data-set 2 is % s" % (median(data2)))
print("Median of data-set 3 is % s" % (median(data3)))
print("Median of data-set 4 is % s" % (median(data4)))
print("Median of data-set 5 is % s" % (median(data5)))
输出:
Median of data-set 1 is 5
Median of data-set 2 is 5.9
Median of data-set 3 is 2
Median of data-set 4 is -5
Median of data-set 5 is 0.0
中低
median_low()函数在元素个数为奇数的情况下返回数据的中位数,但在元素个数为偶数的情况下,返回两个中间元素中较低的一个。如果传递的参数为空,则引发StatisticsError
例子:
蟒蛇3
# Python code to demonstrate the
# working of median_low()

# importing the statistics module
import statistics

# simple list of a set of integers
set1 = [1, 3, 3, 4, 5, 7]

# Print median of the data-set

# Median value may or may not
# lie within the data-set
print("Median of the set is % s"
    % (statistics.median(set1)))

# Print low median of the data-set
print("Low Median of the set is % s "
    % (statistics.median_low(set1)))
输出:
Median of the set is 3.5
Low Median of the set is 3
中高
median_high()函数在元素为奇数的情况下返回数据的中位数,但在元素数为偶数的情况下,返回两个中间元素中较高的一个。如果传递的参数为空,则引发StatisticsError 。
例子:
蟒蛇3
# Working of median_high() and median() to
# demonstrate the difference between them.

# importing the statistics module
import statistics

# simple list of a set of integers
set1 = [1, 3, 3, 4, 5, 7]

# Print median of the data-set

# Median value may or may not
# lie within the data-set
print("Median of the set is %s"
    % (statistics.median(set1)))

# Print high median of the data-set
print("High Median of the set is %s "
    % (statistics.median_high(set1)))
输出:
Median of the set is 3.5
High Median of the set is 4
模式
它是给定数据集中出现频率最高的值。如果所有数据点的频率相同,则数据集可能没有众数。此外,如果我们遇到两个或多个具有相同频率的数据点,我们可以拥有不止一种模式。
mode()函数返回出现次数最多的数字。如果传递的参数为空,则引发StatisticsError 。
例子:
蟒蛇3
# Python code to demonstrate the
# working of mode() function
# on a various range of data types

# Importing the statistics module
from statistics import mode

# Importing fractions module as fr
# Enables to calculate harmonic_mean of a
# set in Fraction
from fractions import Fraction as fr

# tuple of positive integer numbers
data1 = (2, 3, 3, 4, 5, 5, 5, 5, 6, 6, 6, 7)

# tuple of a set of floating point values
data2 = (2.4, 1.3, 1.3, 1.3, 2.4, 4.6)

# tuple of a set of fractional numbers
data3 = (fr(1, 2), fr(1, 2), fr(10, 3), fr(2, 3))

# tuple of a set of negative integers
data4 = (-1, -2, -2, -2, -7, -7, -9)

# tuple of strings
data5 = ("red", "blue", "black", "blue", "black", "black", "brown")


# Printing out the mode of the above data-sets
print("Mode of data set 1 is % s" % (mode(data1)))
print("Mode of data set 2 is % s" % (mode(data2)))
print("Mode of data set 3 is % s" % (mode(data3)))
print("Mode of data set 4 is % s" % (mode(data4)))
print("Mode of data set 5 is % s" % (mode(data5)))
输出:
Mode of data set 1 is 5
Mode of data set 2 is 1.3
Mode of data set 3 is 1/2
Mode of data set 4 is -2
Mode of data set 5 is black
请参阅以下文章以获取有关集中趋势的平均值和度量的详细信息。
- Python的统计函数 |设置 1(中心位置的平均值和测量值)
可变性的测量
到目前为止,我们已经研究了集中趋势的测度,但仅此不足以描述数据。为了克服这个问题,我们需要可变性的度量。可变性的度量被称为数据的传播或我们的数据分布情况。最常见的可变性度量是:
- 范围
- 方差
- 标准差

范围
我们数据集中最大和最小数据点之间的差异称为范围。范围与数据的传播成正比,这意味着范围越大,数据传播越多,反之亦然。
Range = Largest data value – smallest data value
我们可以分别使用max()和min()方法计算最大值和最小值。
例子:
蟒蛇3
# Sample Data
arr = [1, 2, 3, 4, 5]

#Finding Max
Maximum = max(arr)
# Finding Min
Minimum = min(arr)

# Difference Of Max and Min
Range = Maximum-Minimum
print("Maximum = {}, Minimum = {} and Range = {}".format(
    Maximum, Minimum, Range))
输出:
Maximum = 5, Minimum = 1 and Range = 4方差
它被定义为与平均值的平均平方偏差。它的计算方法是找出每个数据点与平均值(也称为均值)之间的差异,将它们平方,将所有数据相加,然后除以数据集中存在的数据点数。

其中 N = 项数
u = 平均值
统计模块提供了方差()方法,该方法在幕后进行所有数学运算。如果传递的参数为空,则引发StatisticsError 。
例子:
蟒蛇3
# Python code to demonstrate variance()
# function on varying range of data-types

# importing statistics module
from statistics import variance

# importing fractions as parameter values
from fractions import Fraction as fr

# tuple of a set of positive integers
# numbers are spread apart but not very much
sample1 = (1, 2, 5, 4, 8, 9, 12)

# tuple of a set of negative integers
sample2 = (-2, -4, -3, -1, -5, -6)

# tuple of a set of positive and negative numbers
# data-points are spread apart considerably
sample3 = (-9, -1, -0, 2, 1, 3, 4, 19)

# tuple of a set of fractional numbers
sample4 = (fr(1, 2), fr(2, 3), fr(3, 4),
           fr(5, 6), fr(7, 8))

# tuple of a set of floating point values
sample5 = (1.23, 1.45, 2.1, 2.2, 1.9)

# Print the variance of each samples
print("Variance of Sample1 is % s " % (variance(sample1)))
print("Variance of Sample2 is % s " % (variance(sample2)))
print("Variance of Sample3 is % s " % (variance(sample3)))
print("Variance of Sample4 is % s " % (variance(sample4)))
print("Variance of Sample5 is % s " % (variance(sample5)))
输出:
Variance of Sample1 is 15.80952380952381
Variance of Sample2 is 3.5
Variance of Sample3 is 61.125
Variance of Sample4 is 1/45
Variance of Sample5 is 0.17613000000000006
标准差
它被定义为方差的平方根。它是通过找到平均值来计算的,然后从平均值中减去每个数字,平均值也称为平均值并对结果求平方。将所有值相加,然后除以平方根后的项数。

其中 N = 项数
u = 平均值
标准差() 统计模块的方法返回数据的标准偏差。如果传递的参数为空,则引发StatisticsError 。
例子:
蟒蛇3
# Python code to demonstrate stdev()
# function on various range of datasets

# importing the statistics module
from statistics import stdev

# importing fractions as parameter values
from fractions import Fraction as fr

# creating a varying range of sample sets
# numbers are spread apart but not very much
sample1 = (1, 2, 5, 4, 8, 9, 12)

# tuple of a set of negative integers
sample2 = (-2, -4, -3, -1, -5, -6)

# tuple of a set of positive and negative numbers
# data-points are spread apart considerably
sample3 = (-9, -1, -0, 2, 1, 3, 4, 19)

# tuple of a set of floating point values
sample4 = (1.23, 1.45, 2.1, 2.2, 1.9)

# Print the standard deviation of
# following sample sets of observations
print("The Standard Deviation of Sample1 is % s"
      % (stdev(sample1)))

print("The Standard Deviation of Sample2 is % s"
      % (stdev(sample2)))

print("The Standard Deviation of Sample3 is % s"
      % (stdev(sample3)))


print("The Standard Deviation of Sample4 is % s"
      % (stdev(sample4)))
输出:
The Standard Deviation of Sample1 is 3.9761191895520196
The Standard Deviation of Sample2 is 1.8708286933869707
The Standard Deviation of Sample3 is 7.8182478855559445
The Standard Deviation of Sample4 is 0.41967844833872525
请参阅以下文章以获取有关变异性度量的详细信息。
- Python的统计函数 |设置 2(传播度量)